Comparison charts
Four synthesis charts built from the wiki’s normalized modality data
(src/data/charts/modalities.json) and the enhanced-Raman dossier. Every number
behind them is cited on the corresponding modality page; ranges reflect the
published spread across each family, so treat them as landscape orientation, not
datasheet values. Regenerate after data edits with node ops/generate-charts.mjs.
The sensitivity landscape
Section titled “The sensitivity landscape”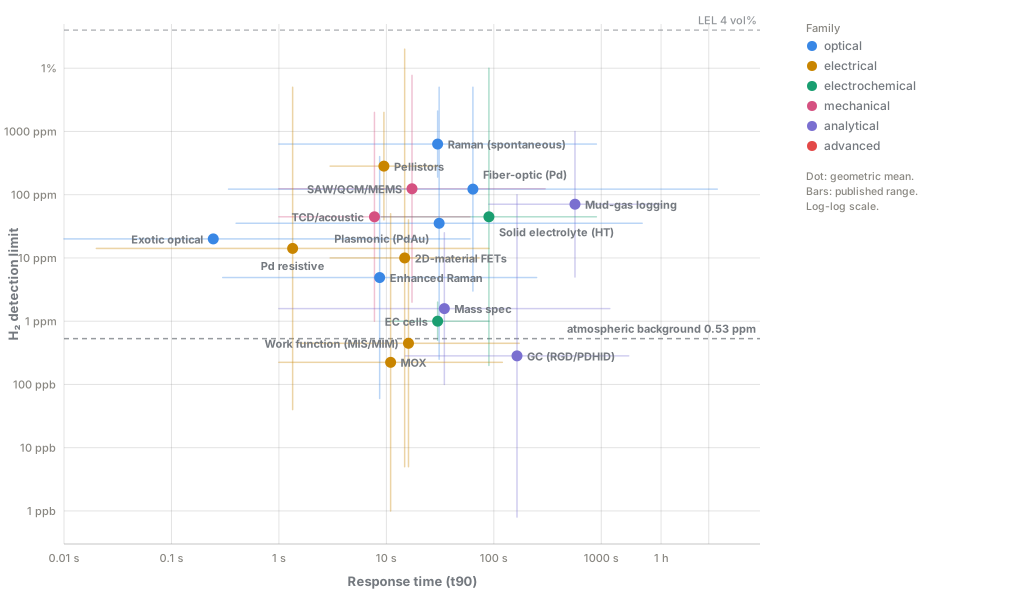
The lower-left corner (fast and trace-sensitive) is essentially empty: sensitivity costs either time (GC cycles, cavity integration) or selectivity (MOX’s sub-ppm claims come with severe covariance; see the matrix below). The sensor-selection guide walks the same trade space use-case by use-case.
The confounder matrix
Section titled “The confounder matrix”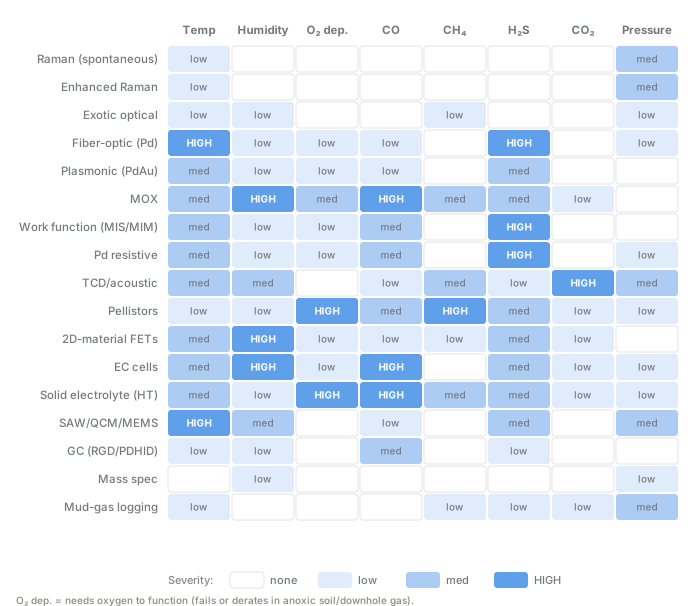
By row, optical scattering techniques (Raman) are nearly clean; anything palladium-catalytic shares the H₂S column; MOX and electrochemical cells carry the humidity and CO burden that dominates the soil-survey artifact debate (environmental covariance has the coefficients).
Temperature envelopes vs. the downhole window
Section titled “Temperature envelopes vs. the downhole window”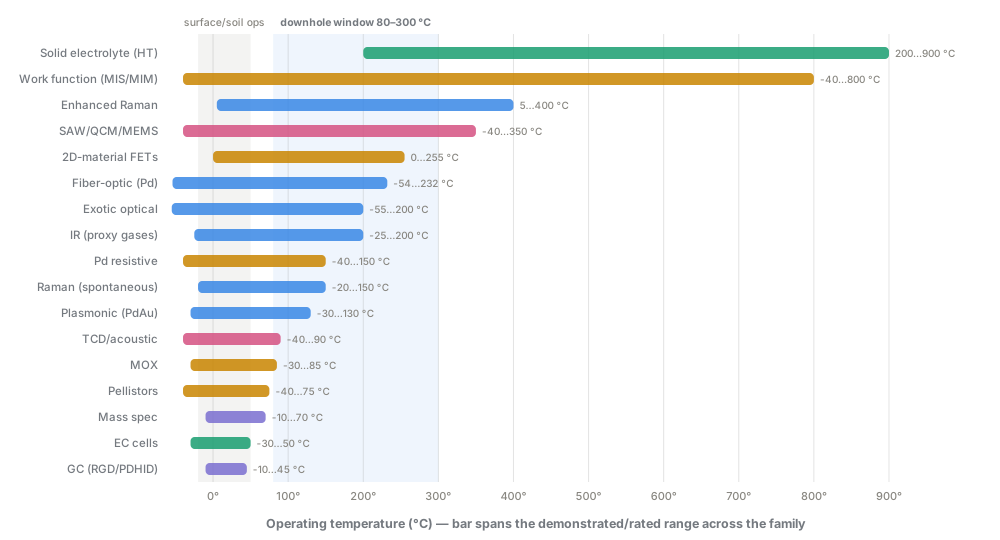
The 100–200 °C band, where most candidate wells sit, is served by almost nothing deployable today; that gap and its workarounds are the subject of downhole & borehole sensing.
The Raman enhancement ladder
Section titled “The Raman enhancement ladder”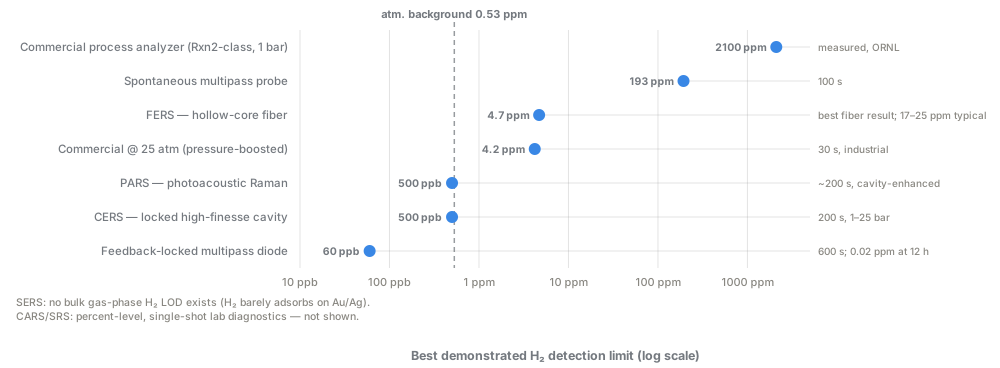
Spontaneous Raman’s ~10⁻³⁰ cm²/sr cross-section is the physics floor; every rung below ~200 ppm relies on an enhancement technique (pressure, multipass, cavities, hollow-core fiber), each adding its own complexity, detailed on enhanced Raman.
Why H₂ is a hard target: two physics pictures
Section titled “Why H₂ is a hard target: two physics pictures”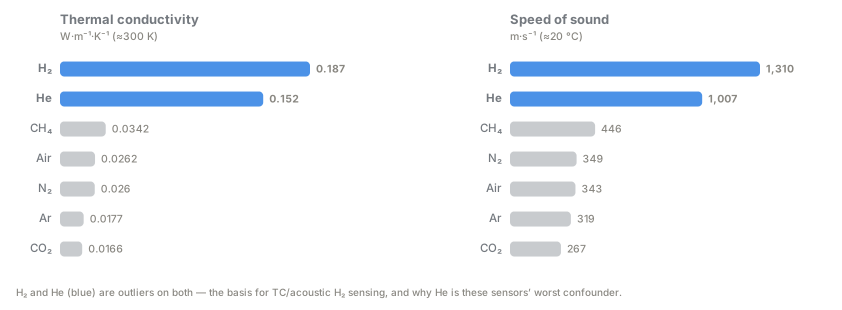
Hydrogen and helium are the only gases far from the rest on both transport properties. That outlier status is what thermal-conductivity and acoustic sensors exploit, and why helium is their worst confounder.
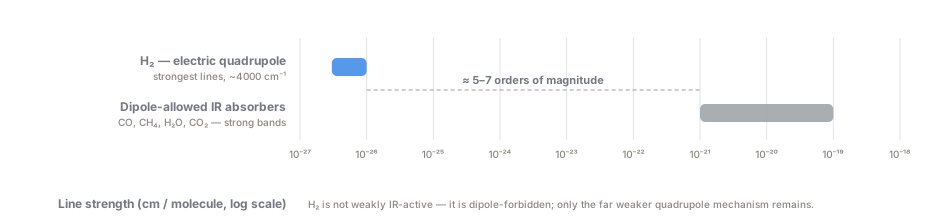
Hydrogen’s only infrared coupling is the electric-quadrupole mechanism, five to seven orders of magnitude weaker than the dipole-allowed bands behind every cheap NDIR CO₂ or methane sensor. This is why direct IR sensing of H₂ is a dead end and where why H₂ is hard starts.