Mass spectrometry (portable, membrane-inlet, isotopes)
Summary
Section titled “Summary”Every other sensor on this wiki works by letting hydrogen touch something — a heated wire, a catalyst, a membrane, a laser beam — and reading how that something changes. Mass spectrometry works differently: it breaks gas molecules into charged fragments, sorts those fragments by weight on a sub-atomic scale, and counts them one by one. Rather than responding to a bulk property of hydrogen, it weighs it. That gives mass spectrometry (MS) two abilities no field sensor has.
First, because it registers every mass present in a sample in one pass, it identifies and quantifies dozens of gases simultaneously, catching contaminants and cross-checks that a single-gas sensor cannot see. Second, and the ability most relevant to Hestia, it can weigh the different isotopes of hydrogen — ordinary ¹H versus heavy deuterium, ²H — precisely enough to identify where a gas came from: ancient rock chemistry deep in the crust, microbial activity, or a leak from oilfield equipment. No handheld gas detector can answer that question.
The cost of these abilities is that MS is not a field-survey instrument: it needs a vacuum system, trained operation, and ongoing calibration, so in practice it lives in a laboratory or a wellsite trailer, not inside a soil-gas probe. It is also mediocre at the job most of Hestia’s other sensors exist to do — cheap, continuous, low-ppm H2 concentration measurement — because hydrogen sits at the hardest mass in the periodic table to measure cleanly. MS’s role in the toolkit is as the reference-truth backstop: the isotope laboratory that identifies what kind of hydrogen you found, the wellsite service that tracks gas composition in near-real time while drilling, and, through a membrane-inlet variant, a promising way to continuously monitor dissolved hydrogen in a groundwater well.
At a glance — published performance envelope
- Detection limit
- 0.1–25 ppm
- Range
- 0.1–1,000,000 ppm
- Response t90
- 1–1,200 s
- Recovery
- 5–1,800 s
- Selectivity
- high
- Drift
- medium
- Operating T
- −10 … 70 °C
- Humidity
- 10–90 % RH
- Power
- 35–1,500 W
- Unit cost
- $5k–$150k
- TRL
- 8
Main interferents: He, D, H₂O, CO · poisons: siloxane, pump oil, sustained high H2S. Ranges span the published devices/variants covered below — per-claim citations are in the body; data: src/data/modalities/mass-spectrometry.yaml.
Mechanism & physics
Section titled “Mechanism & physics”Mass spectrometry does not respond to a bulk physicochemical property of H2 the way an electrochemical cell or a metal-oxide resistor does. It ionizes a sample, sorts the resulting ions by mass-to-charge ratio , and counts them.
Every quantitative and qualitative virtue and flaw of MS for geologic-H2 work traces back to three linked sub-processes:
- electron-impact ionization efficiency
- mass-filtering physics at the lightest end of the periodic table
- how sample gas or dissolved gas is gotten into the vacuum system in the first place
Understanding each explains why m/z = 2 is the hardest mass to measure in residual-gas analysis.
Electron-impact ionization and relative sensitivity
Section titled “Electron-impact ionization and relative sensitivity”The vast majority of instruments relevant to this page — quadrupole residual gas analyzers (RGAs), process gas analyzers, and membrane-inlet MS (MIMS) — use electron-impact (EI) ionization: a hot filament thermionically emits electrons that are accelerated to a controlled energy (typically 70 eV, with SRS RGA heads programmable from 25–105 eV) and collide with neutral gas molecules in an open-mesh ion source, producing positive ions and secondary electrons [1].
Ionization efficiency is governed by the energy-dependent ionization cross section . For H2, rises from a threshold near the ionization potential, increases roughly linearly with electron energy, and reaches a broad maximum somewhere in the 50–100 eV range before slowly declining — a shape common to essentially all neutral molecules, explicitly noted in the SRS RGA manual [1].
The classic absolute measurements of total ionization cross sections for H2, D2, He, N2, and other permanent gases were made by Rapp and Englander-Golden in 1965 and remain the reference values used to normalize modern electron-impact cross-section databases, including NIST’s Electron-Impact Cross Sections for Ionization and Excitation Database [4][5][6].
H2’s ionization cross section is smaller than that of most other common gases, including the N2 used as the industry calibration standard. This is quantified by the relative sensitivity factor (RSF), , defined so that the gauge/analyzer sensitivity for gas is
with . A frequently reproduced table (traceable to Summers’ 1969 NASA compilation and still distributed by Stanford Research Systems) gives , , , , , , and [2][3]. Vendor application literature reports a comparable measured H2/N2 RSF near 0.46, with a literature spread of roughly 0.33–0.70 depending on filament material, electron energy, and ion-source geometry — underscoring that these factors are empirical and instrument-specific, not universal constants [2].
The physical reason for hydrogen’s low RSF is straightforward: H2 has only two electrons and the smallest polarizability of any diatomic molecule, and ionization cross section correlates strongly with polarizability and electron count.
For multi-component spectra, the standard linear-superposition formalism used across virtually all quadrupole RGA/QMS software treats the total ion current at each nominal mass as the sum of fragment contributions from every gas present:
where is the fragmentation factor of gas at mass (normalized to 1 at that gas’s principal peak), is its partial-pressure sensitivity factor (amp/Torr), and is its partial pressure [1]. Because most gases produce more mass peaks than there are unknown gases, the system of equations in is over-determined and solved by multiple linear regression — this is literally how “Analyze” functions in RGA software back out a gas mixture’s composition from one scan [1].
The entire quantitative edifice depends on and being well characterized for the specific ionizer settings, detector, and multiplier gain in use — a nontrivial calibration burden that field users routinely underestimate.
Quadrupole mass filtering: the physics of the low-mass cutoff
Section titled “Quadrupole mass filtering: the physics of the low-mass cutoff”The workhorse mass analyzer in essentially every instrument discussed here (SRS RGA100/200/300, Hiden HAL/QGA, Pfeiffer OmniStar/ThermoStar, Hiden HPR-40) is the linear quadrupole mass filter: four parallel cylindrical rods, opposite pairs wired together, driven by a combined DC and RF potential
superimposed with alternating sign on the two rod pairs [1]. Ions injected along the central z-axis experience a two-dimensional time-varying quadrupole field; their transverse trajectories are described by the Mathieu equation,
(; = inscribed rod radius; ). Only ions whose point falls inside the first stability region of the Mathieu diagram reach the detector with bounded, non-diverging oscillation amplitude; all others strike the rods and are lost. Qualitatively, in the X-direction the filter behaves as a high-pass mass filter (light ions are unstable and discharge on the rods), while in the Y-direction it is a low-pass mass filter (heavy ions are defocused by the DC component); the intersection of the two gives a narrow band-pass in mass [1].
Sweeping and together at fixed ratio scans the transmitted mass; changing the ratio changes the filter’s resolving power. The SRS RGA rod set operates at MHz with an inscribed-circle rod radius of 0.109 in [1].
Resolution and resolving power are defined as (peak full-width at 10% of maximum height, in amu) and (dimensionless) [1]. Commercial RGAs are run in “constant-” mode with typically set to 1 amu at the factory — adequate to resolve integer masses across the whole range but hopeless for resolving isobars separated by a few millidaltons (below).
The theoretical minimum attainable by a given quadrupole is mass-independent, scales linearly with ion kinetic energy, and scales inversely with the square of (rod length × RF frequency); the SRS RGA’s two selectable ion-energy settings (8 eV / 12 eV) correspond to ultimate resolutions of about 0.3 and 0.5 amu respectively — well under the 1 amu factory default [1]. There is an unavoidable trade-off: as resolving power increases (larger DC/RF ratio), transmitted ion current, and hence sensitivity, falls, empirically at 1–1.5× the rate of the resolving-power increase [1].
Because is held constant with mass in normal operation, the resolving power — and therefore the effective throughput penalty — increases with mass, meaning quadrupole throughput systematically decreases toward high mass, a fact relevant when correcting partial-pressure sensitivities across a wide mass range [1].
Zero-blast suppression is the low-mass artifact most relevant here. At the start of a mass scan, DC and RF amplitudes pass through zero; ions with mathematically “unstable” trajectories can nonetheless be transiently transmitted near zero potential, producing a spurious signal spike called the “zero blast.” All commercial RGAs suppress this by preventing the DC voltage from reaching zero below roughly 1.5 amu — standard practice, but explicitly documented by SRS as “responsible for the lack of reliable readings for hydrogen at 1 amu” [1].
This affects the atomic-hydrogen fragment H⁺ at m/z = 1, not H2⁺ at m/z = 2 (which sits safely above the suppressed region), but it removes one otherwise-useful cross-check peak from the hydrogen fragmentation pattern and is a good illustration of how close to the analyzer’s hard floor H2 measurement sits.
The m/z = 2–4 problem set: isobars, H3⁺ chemistry, and He tailing
Section titled “The m/z = 2–4 problem set: isobars, H3⁺ chemistry, and He tailing”This is why H2 mass spectrometry is hard, and it is fundamentally a mass-resolution problem rooted in isotope arithmetic rather than an electronics problem. Using standard isotope masses (¹H = 1.007825 u, ²H/D = 2.014102 u, ³H/T = 3.016049 u, ⁴He = 4.002602 u), the nominal-integer masses 2, 3, and 4 each host multiple chemically distinct species separated by only a few millidaltons:
| Nominal m/z | Species present | Exact mass (u) | Δ to nearest neighbor (u) | Resolving power needed |
|---|---|---|---|---|
| 2 | H2⁺ | 2.015650 | — | — |
| 2 | D⁺ (atomic deuterium ion) | 2.014102 | 0.001548 from H2⁺ | ≈1300 |
| 3 | HD⁺ | 3.021927 | — | — |
| 3 | H3⁺ | 3.023475 | 0.001548 from HD⁺ | ≈1950 |
| 3 | T⁺ | 3.016049 | 0.005878 from HD⁺ | ≈510 |
| 4 | He⁺ (⁴He) | 4.002602 | — | — |
| 4 | D2⁺ | 4.028204 | 0.025602 from He⁺ | ≈160 |
| 4 | HT⁺ | 4.021927 | 0.019325 from He⁺ | ≈210 |
(Resolving powers computed from standard isotope masses.) A quadrupole RGA operated at its normal factory resolution ( amu) cannot come remotely close to the –2000 needed to separate any of these pairs. Practically, this means a quadrupole simply reports one lumped ion current at nominal mass 2, 3, or 4: it cannot natively tell whether the m/z = 2 signal is H2⁺ or partly D⁺ contamination, and it cannot separate the important He (m/z 4, atmospheric background) signal from co-occurring D2 or HT except by their very different natural abundances.
Purpose-built magnetic-sector isotope-ratio instruments exist precisely to buy the resolving power quadrupoles lack, at the cost of size, price, and field-ruggedness [7][8][9].
Superimposed on the isobar problem is ion-molecule chemistry inside the ionizer itself. Once H2⁺ is formed, at sufficiently high local H2 partial pressure in the source it can react with a neutral H2 molecule via , generating a persistent H3⁺ signal at m/z = 3 that is a source-pressure-dependent artifact rather than a fixed fragmentation-pattern ratio.
Because H3⁺, HD⁺, and T⁺ are simultaneously present and effectively unresolvable at typical quadrupole resolution, published work on hydrogen-isotope QMS explicitly frames m/z = 3 as requiring either very high mass resolution (one process-monitoring context quotes “resolution greater than 930” to accurately resolve HT and D2 from adjacent species) or a mathematical deconvolution/correction model calibrated against known gas mixtures [8][9][7].
Helium as the m/z = 4 co-tracer, and its own interference problem. He is both the classic vacuum-system leak-check tracer and, independently, the principal companion noble-gas tracer in natural-hydrogen and natural-helium exploration, because crustal-radiogenic ⁴He and mantle-derived ³He/⁴He ratios (, normalized to the atmospheric ratio) fingerprint the same deep-crustal or mantle source processes that generate geologic H2 [30][23][24]. Atmospheric He background is small and well constrained — the classical Glueckauf value of 5.24 ± 0.004 ppmv is still the reference figure cited in current atmospheric-helium metrology work [34], with a more recent isotope-dilution determination of 5.222 ± 0.017 ppmv (unverified) essentially confirming it.
Because m/z = 4 is shared with D2⁺ and HT⁺ fragments of any deuterated hydrogen in the same gas, and because He⁺ itself carries essentially no fragmentation pattern (monatomic, chemically inert), high-resolution noble-gas mass spectrometers are the instrument of choice whenever accurate ³He/⁴He is required; ordinary quadrupole RGAs can only give a semi-quantitative bulk He estimate at m/z = 4 [30].
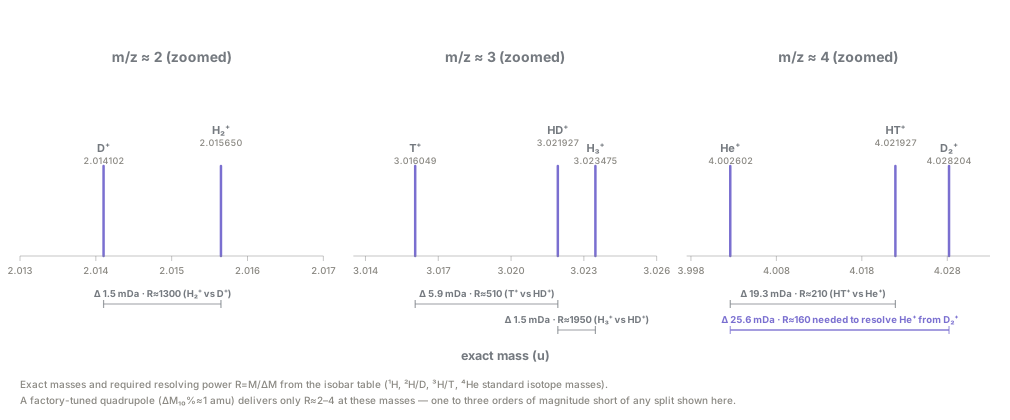
Separating He+ from D2+ alone needs R≈160 — one to three orders of magnitude beyond the R≈2–4 a factory-tuned quadrupole delivers at these masses.
Isotope-ratio mass spectrometry (IRMS) and the δ-notation
Section titled “Isotope-ratio mass spectrometry (IRMS) and the δ-notation”Hydrogen-isotope (“δD” or “δ²H”) measurement — the primary genetic fingerprint for classifying natural-hydrogen origin — is reported as a per-mil (‰) deviation from Vienna Standard Mean Ocean Water (VSMOW):
Modern gas-source IRMS instruments (e.g., the Thermo Scientific Delta series) achieve this by converting sample hydrogen — via combustion/pyrolysis, or directly for a gas sample — to H2 gas, then measuring the ratio of ion currents at m/z 2 (H2⁺) and m/z 3 (HD⁺) in a magnetic-sector, multi-collector instrument with Faraday cups tuned for the large dynamic-range separation this ratio requires (natural D/H abundance ≈ 155 ppm) [31][32]. High-Temperature Conversion/Elemental Analysis (TC/EA or HTC/HTP) coupled on-line to IRMS pyrolyzes solid/liquid samples at >1400 °C to CO and H2, chromatographically separates them, and feeds the H2 split-stream to the mass spectrometer — the standard sample-preparation front end for hydrogen-isotope work on Thermo Delta-series instruments [22].
Typical two-sigma analytical precision quoted for TC/EA-IRMS δD analysis on a Thermo Delta V is on the order of ±2‰ [32], though hydrogen generally carries the largest analytical uncertainty of the light stable isotopes (±0.5–2.0‰, versus ±0.1–0.2‰ for C, N, O, S) — reflecting the intrinsically low natural D/H ratio and the H3⁺-interference chemistry above.
This is squarely a methods-consuming research area rather than an instrumentation-development one: a fast-growing geochemistry literature — tracing to the foundational 2018 Bourakebougou (Mali) natural-hydrogen discovery papers [25] and continuing through broad geochemical-origin reviews [23] and 2024-era database compilations [22] — is actively building out δD-H2 reference ranges for green/grey/brown/white/natural hydrogen and refining the crustal-vs-mantle-vs-primordial classification scheme, explicitly recommending integration with companion He-isotope and δ¹³C-CH4 data for reliability — see Isotopes & fingerprinting for how this full multi-tracer bundle gets assembled into a field source-attribution call.
Membrane-inlet mass spectrometry (MIMS): permeation-diffusion physics
Section titled “Membrane-inlet mass spectrometry (MIMS): permeation-diffusion physics”MIMS solves an entirely different problem: getting a dissolved gas out of a liquid (or a gas mixture at ambient pressure) into the MS vacuum without a pump-down cycle. The standard approach places a thin gas-permeable membrane — almost universally polydimethylsiloxane (PDMS, “silicone rubber”) — between the liquid/gas sample and the MS vacuum.
Gas molecules partition into the membrane at the wetted face, diffuse across it, and desorb into the vacuum, where they are pumped directly into the ion source — a process the industry literature calls pervaporation [12]. In steady state the flux across a membrane of thickness approximates Fick’s law with an effective permeability (diffusivity times partition/solubility coefficient ):
since under active pumping. The characteristic response time is set by the diffusion time across the membrane, , which is why MIMS response is reported in seconds-to-minutes rather than milliseconds: it is diffusion-limited, not ionization-limited [12].
PDMS is chosen because it is permeable to small nonpolar and weakly polar gas molecules (O2, N2, CO2, CH4, H2S, and — of direct relevance here — H2) while excluding bulk water, letting the vacuum system see “dry” gas even though the sample side is liquid. This mechanism underlies every commercial dissolved-gas MIMS instrument, including the Hiden HPR-40 DSA and the field-portable Gasometrix miniRUEDI [12][19][20].
Variants & subtypes
Section titled “Variants & subtypes”- Lab-bench quadrupole RGA/QMS. The canonical form: a quadrupole probe mounted directly on a 2.75” CF vacuum flange, an electron-impact ionizer, a Faraday cup or electron-multiplier detector, and PC software (e.g., SRS RGA100/200/300; Hiden’s HAL 201 series underlying the QGA) [1][13]. Operates in high/ultra-high vacuum (10⁻⁴ Torr to UHV); gas must already be at low pressure or admitted through a controlled leak/capillary [1].
- Process/field-transportable quadrupole gas analyzer. Same physics as above but packaged with an internal turbo/diaphragm pump train and a heated capillary or leak-valve inlet so it can sample directly from a process stream or ambient/atmospheric-pressure gas (e.g., Hiden QGA/QGA 2.0; Pfeiffer OmniStar for process gas, ThermoStar for coupling to thermal-analysis/TGA off-gas) [13][14][15][16]. “Transportable,” not truly hand-portable — bench-top boxes on the order of tens of kilograms, mains-powered.
- Membrane-inlet mass spectrometer (MIMS). A quadrupole MS coupled to a PDMS membrane probe/flow-cell/cuvette submerged in or flowed past a liquid (or slurry) sample, purpose-built for dissolved-gas and dissolved-VOC analysis (Hiden HPR-40 DSA/DEMS) [12]. A field-deployable, autonomous variant with a self-contained membrane-equilibrator inlet exists for on-site groundwater and surface-water dissolved-gas monitoring (the academic miniRUEDI, and its predecessor lab-grade groundwater-MIMS instruments) [17][19][20][21].
- Portable/handheld mass spectrometers. A broad, mostly non-H2-focused commercial category (Purdue Mini-series, 908 Devices MX908/M908, Inficon HAPSITE, 1st Detect MMS-1000, Torion GUARDION/TRIDION) built around miniaturized ion traps or quadrupoles with reduced pumping requirements (diaphragm + small turbo, or getter pumps), primarily marketed for narcotics/explosives/CWA detection via ambient ionization, not permanent-gas analysis [11]. A distinct, much less commercialized lineage of research-grade portable ion-trap instruments purpose-built for light permanent gases (H2, He, O2, Ar) exists and has been demonstrated down to sub-25-ppm H2 detection limits for aerospace (NASA Space Shuttle cryogenic-leak-monitoring) applications, but this class has not, to date, reached routine commercial availability for geologic-H2 field work [10][11].
- Isotope-ratio mass spectrometry (IRMS). Magnetic-sector, multi-Faraday-cup instruments purpose-built for high-precision isotope-ratio measurement, run in dual-inlet mode (highest precision, comparing sample against a reference gas by rapid switching) or continuous-flow mode (coupled to GC or TC/EA for on-line sample introduction) [31][32][22]. The Thermo Scientific Delta series is the dominant commercial line referenced in the geochemistry literature for δD-H2 and companion δ¹³C-CH4 work [22][31].
- Noble-gas mass spectrometers. Static-vacuum, magnetic-sector instruments (e.g., instruments in the Thermo “Helix” family) purpose-built for helium/neon/argon/krypton/xenon isotope ratios, combining Faraday cups for abundant isotopes (⁴He, ²⁰Ne, ⁴⁰Ar) with electron multipliers for trace isotopes (³He, Kr, Xe), used as the He-isotope companion technique to hydrogen exploration [30]. The closely related ³H/³He (tritium-helium) dating method uses the same noble-gas MS infrastructure, measuring the ⁴He/³He isotope ratio to quantify “tritiogenic” ³He grown in from radioactive tritium decay, and is the standard method for dating young (post-1965) groundwater [29].
- Wellsite mud-logging GC-MS and GC-C-IRMS. Gas-chromatograph front ends (for species separation) coupled to either a bench-style quadrupole MS or a combustion-interface IRMS, packaged into a skid/cabin deployed trailer-side at a drilling rig for real-time or near-real-time compositional and isotopic mud-gas analysis (mud gas isotope logging, MGIL) [26][27][28]. See gas chromatography for the separation front end and mud gas logging for the wellsite-service context.
Performance envelope
Section titled “Performance envelope”Every number below is instrument-specific and calibration-gas-dependent (see the RSF discussion above); treat this table as an envelope across the commercial/demonstrated landscape, not a single spec sheet.
| Instrument class | H2 detection limit | Dynamic range | Response time | Mass resolution | Power | Approx. cost class | Ref |
|---|---|---|---|---|---|---|---|
| Lab QMS/RGA, Faraday cup (SRS RGA100) | MDPP 5×10⁻¹¹ Torr | 10⁻⁴ Torr–UHV; ~6 decades single-mass | seconds per scan point (electrometer auto-ranging) | ΔM₁₀%≈1 amu (0.3–0.5 amu ultimate) | 24 VDC @ 2.5 A (~60 W) | ~US $5k base unit (list ~$4,950, historical, unverified current) | [1] |
| Lab QMS/RGA, electron multiplier (SRS RGA + CDEM option) | MDPP 5×10⁻¹⁴ Torr | 7 decades (dark-current to bias-current limited) | seconds | same as above | as above + HV supply | + multiplier option, unverified $ | [1] |
| Process/transportable QMS (Hiden QGA / QGA 2.0) | ~100 ppb (species-dependent) | 100 ppb–100% (7 decades) | up to 1000 measurements/s (electronic); gas-handling adds lag | mass range 1–200/300 amu | not disclosed | quote-only (unverified) | [13][14] |
| Process gas analyzer (Pfeiffer OmniStar/ThermoStar GSD 320) | <1 ppm (C-SEM detector), <40 ppm (Faraday) | 1–100/200/300 amu | capillary inlet, sample at ~1000 mbar, seconds-scale (not further specified) | ΔM contribution to neighboring mass <20 ppm | not disclosed | quote-only (unverified) | [15][16] |
| Membrane-inlet MS, bench (Hiden HPR-40 DSA) | 100%–60 ppt (species- and interference-dependent; realistic H2 floor is ppm-level owing to vacuum-system H2 background, not the ppt figure quoted for heavier VOCs) | wide, mass range 1–200/300 amu | seconds–minutes (membrane diffusion-limited) | up to 650 measurements/s electronic scan rate | 1.2 kVA | quote-only (unverified); ~33 kg + 7 kg pump | [12] |
| Field-portable MIMS (Gasometrix miniRUEDI) | not H2-specific in the base gas suite reviewed (base: He, Ne, Ar, Kr, N2, O2, CO2; extended methods add CH4, H2S, H2 per vendor) | wide | ~20 min stabilization after inlet switch (H2O persistence); base system scans m/z 14–44 | ΔM ≤0.5 amu | 50 W | quote-only (unverified); 32 kg incl. case | [19][20][21] |
| Research portable ion-trap MS (NASA/Univ. Florida prototype) | <25 ppm H2, <100 ppm He | mass range 2–50 Da | not quantified in source | unit mass, no buffer gas, elevated trapping frequency | not disclosed | research prototype, not commercial | [10] |
| Miniature/handheld general-purpose MS (Mini 11/12, M908, HAPSITE — context, not H2-validated) | not applicable — no demonstrated H2 capability found | n/a | n/a | unit mass | 4–65 W (device-dependent) | commercial, ~2–15 kg class devices | [11] |
| IRMS + TC/EA for δD-H2 (Thermo Delta series) | n/a (isotope ratio, not concentration) | δD range effectively unlimited (per-mil scale) | minutes per sample (batch) | resolving isobars at m/z 2/3 by design (magnetic sector) | lab infrastructure (kW-class incl. pumps) | quote-only (unverified); high-capex lab instrument | [22][31][32] |
| GC-C-IRMS wellsite skid (MGIL) | H2 quantification down to <5 ppm reported as a calibration target for mud-logging GC-MS | field/rig-site, hours-to-days per well interval | near-real-time relative to drilling rate | isotope-resolving (δ¹³C, δ²H) | rig power | contracted mud-logging service, day-rate (unverified $) | [26][27][28] |
Additional scalars worth carrying into selection discussions:
- The N2-calibration trap. An instrument calibrated only against N2 under-reports true H2 partial pressure by roughly a factor of 2 unless a gas-specific H2 sensitivity factor is applied — a correction, not a hardware fix, but one that is trivial to forget in the field [1][2][3].
- CDEM gain vs. mass. Continuous-dynode electron-multiplier gain decreases with increasing ion mass (an approximate inverse-square-root-of-mass dependence for monatomic ions of equal energy), so light H2⁺ ions get a partial multiplier-gain advantage that offsets some of the RSF penalty above — but this requires its own cross-calibration against the Faraday-cup signal [1].
- Resolving power required. Separating H2⁺ from D⁺ contamination at m/z 2 needs ; separating HD⁺/H3⁺/T⁺ at m/z 3 needs –2000; separating He⁺ from D2⁺/HT⁺ at m/z 4 needs –210 — all one to three orders of magnitude beyond a factory-tuned quadrupole’s amu [1] (see the isobar table above).
Figures of merit
Section titled “Figures of merit”The universal figures of merit — sensitivity, LOD, selectivity, response/recovery time, dynamic range, drift, power, operating envelope — are defined on the Figures of merit page; this table adapts them to what a mass spectrometer actually reports (ion current and partial pressure in Torr, not ppm — see Concentration units) and adds the two FoMs that are unique to this modality: relative sensitivity factor and mass-resolving power.
Figures-of-merit table for this modality (11 rows)
| Figure of merit | Symbol / formula | What it means here | Typical value for this technology | How to read it |
|---|---|---|---|---|
| Sensitivity | Ion current per unit partial pressure, referenced to N2 | ~2×10⁻⁴ A/Torr, N2-referenced Faraday cup (SRS RGA100) [1] | A raw A/Torr number is an N2-calibrated slope, not an H2 slope — not usable without the RSF correction below | |
| Relative sensitivity factor (RSF) | The modality-specific form of sensitivity: H2’s small size and low polarizability give it a genuinely lower ionization cross-section than the N2 used to calibrate virtually every instrument in this class | – (literature spread 0.33–0.70 depending on filament, electron energy, ion-source geometry) [2][3] | Multiply an N2-calibrated H2 reading by to correct; skipping this silently under-reports true H2 partial pressure by roughly 2× — a common H2-MS procurement/operating error | |
| Limit of detection (LOD, partial pressure) | Minimum detectable partial pressure (MDPP) | Smallest H2 partial pressure resolvable above ionizer/detector noise, at a fixed scan/integration time | 5×10⁻¹¹ Torr (Faraday cup) to 5×10⁻¹⁴ Torr (electron multiplier), SRS RGA100 [1]; ~100 ppb species-dependent, Hiden QGA [13]; <1 ppm (C-SEM) / <40 ppm (Faraday), Pfeiffer OmniStar [15] | These are vacuum-electronics floors at seconds-per-scan-point integration, not a field H2 floor — the instrument’s own H2 outgassing/permeation background usually sets the real detection limit for trace geologic H2, and no source reviewed gives a validated H2-specific field LOD distinct from the generic multi-gas MDPP figure (unverified) |
| Resolving power | The modality-defining FoM for H2: whether the instrument can separate H2⁺ from D⁺ at m/z 2, HD⁺/H3⁺/T⁺ at m/z 3, and He⁺ from D2⁺/HT⁺ at m/z 4, instead of reporting one lumped ion current per nominal mass | Needed: (m/z 2), –1950 (m/z 3), –210 (m/z 4); delivered by a factory-tuned quadrupole ( amu): –4 at these masses; magnetic-sector IRMS/noble-gas MS: sufficient by design [1][7][8][9] | A factory quadrupole is one to three orders of magnitude short of the isobar-separation floor — this is the reason quadrupole MS cannot deliver a trustworthy isotope-ratio number without either a deconvolution/correction model or swapping to a magnetic-sector instrument | |
| Selectivity / cross-sensitivity | Linear superposition, | How much of the signal at a nominal mass is really H2 vs. an isobaric neighbor or an overlapping fragment | m/z 2: D⁺ contamination; m/z 3: pressure-dependent H3⁺ artifact () plus HD⁺/T⁺; m/z 4: He⁺ vs. D2⁺/HT⁺; m/z 28: N2 vs. CO vs. CO2 fragment | Unlike a single interferent coefficient, selectivity here is whether the fragmentation-pattern/RSF model is fully characterized for every co-eluting gas — an uncharacterized mixture silently biases the regression that “Analyze” software runs to back out composition [1] |
| Response / recovery time | Seconds per scan point (electronic); diffusion time constant (MIMS) | How fast a reading tracks a real concentration change | Lab QMS/RGA: seconds per scan point [1]; MIMS: seconds–minutes, membrane-diffusion-limited [12]; field-portable MIMS (miniRUEDI): ~20 min stabilization after an inlet switch, driven by H2O persistence [21] | Bench RGA is fast because it is purely electronic; MIMS is slow because it is a membrane pervaporation process — MIMS cannot track a fast transient the way an electrochemical cell can |
| Dynamic range | Span from the detection floor to full-scale partial pressure | Faraday cup: ~6 decades (10⁻⁴ Torr–UHV, single mass) [1]; electron multiplier: ~7 decades (dark-current to bias-current limited) [1]; process QMS (Hiden QGA): 100 ppb–100%, ~7 decades [13] | Wide on paper, but the multiplier’s low-end sensitivity and the Faraday cup’s high-end linearity are usually not both usable at once without re-ranging or a detector swap | |
| Drift / stability | Filament emission efficiency; CDEM gain vs. accumulated output charge | Whether yesterday’s RSF/calibration curve is still valid today | CDEM gain-degradation onset “typically at accumulated output current values of a few thousand µAmp-hr” [1]; no factory-fixed calibration — an ongoing in-house practice (periodic pure-gas sensitivity checks, Faraday/CDEM cross-calibration) is assumed [1] | Unlike a factory-calibrated electrochemical cell, MS is not set-and-forget; budget a recurring calibration labor cost rather than expecting a single warranted drift-rate spec |
| Power | Instrument electrical draw | The deployability constraint that keeps MS out of soil-gas probes and boreholes | SRS RGA100: 24 VDC @ 2.5 A (~60 W) [1]; Hiden HPR-40 DSA (MIMS): 1.2 kVA [12]; field-portable MIMS (miniRUEDI): 50 W [19][20][21]; IRMS + TC/EA: kW-class lab infrastructure including pumps [22][31][32] | Every variant needs a running vacuum pump — there is no battery-only, milliwatt-class MS variant in this dossier; compare against the mW-class budgets of electrochemical/MOX sensors elsewhere in this wiki |
| Operating envelope | Vacuum + temperature domain in which the mass filter’s response stays linear | Where the quantitative partial-pressure scheme actually holds | Quadrupole requires <10⁻⁴ Torr for linear response (space-charge/collisional distortion sets in above ~10⁻⁵ Torr) [1]; SRS RGA head: 70 °C max operating, bakeable to 300 °C (200 °C recommended) to drive off H2O/hydrocarbon background [1] | The mass analyzer itself never sees ambient or downhole pressure directly — every field-capable variant is a differentially pumped inlet bolted onto the same vacuum-only analyzer |
| Isotope-ratio precision (δD-H2) | (‰) | Precision of the D/H ratio — the number that actually classifies H2 origin (biogenic/thermogenic/abiotic) | TC/EA-IRMS on a Thermo Delta V: ~±2‰ (2σ) [32]; hydrogen is generally understood to carry the largest analytical uncertainty of the light stable isotopes, roughly ±0.5–2.0‰ versus ±0.1–0.2‰ for C/N/O/S (unverified — no primary source with full-text access was found for this specific comparison) | This is the FoM that matters for source attribution, not concentration; achieving it requires the resolving power this table’s row above describes — a quadrupole cannot deliver a trustworthy δD-H2 number at all, and isotope-ratio work requires a magnetic-sector instrument |
Environmental covariance & cross-sensitivity
Section titled “Environmental covariance & cross-sensitivity”Environmental factors
Section titled “Environmental factors”Temperature. Ionizer filament behavior, quadrupole RF/DC electronics, and CDEM gain are all temperature-sensitive; the SRS RGA head is rated to 70 °C maximum operating temperature and can be baked to 300 °C (200 °C recommended) specifically to drive off adsorbed water and hydrocarbon film that would otherwise contribute a large, slowly decaying H2O/hydrocarbon background — itself a nuisance signal at masses that can overlap fragment patterns of interest [1]. Temperature-dependent drift of the mass-scale calibration requires re-tuning after significant thermal excursions [1]. For field/process-transportable units, the heated capillary inlet (up to 200–350 °C on Pfeiffer OmniStar/ThermoStar) is itself a temperature-controlled component specifically to prevent water condensation and minimize gas-species fractionation in the sample line [15][16].
Pressure. Quadrupole mass filters require operation below roughly 10⁻⁴ Torr for linear response; above about 10⁻⁵ Torr, space-charge effects in the ionizer and ion-neutral collisional scattering in the filter distort the signal-vs-pressure linearity the entire partial-pressure quantification scheme depends on [1]. This is precisely why every “process” or “transportable” instrument in this class needs its own differentially pumped inlet (capillary, membrane, or leak valve) to step ambient/process pressure down to filter-compatible vacuum — the mass analyzer itself never sees atmospheric or downhole pressure directly.
Relative humidity / water vapor. Water is, along with H2, one of the four gases “virtually every vacuum system will have detectable amounts of,” per SRS’s own troubleshooting guidance, and its cracking pattern (H2O⁺ at 18, OH⁺ at 17, O⁺ at 16, and critically H⁺ at 1 and H2⁺-adjacent fragments) means humid sample streams add background at exactly the masses of hydrogen-isotope interest [1].
For capillary/membrane inlets sampling humid soil gas or groundwater headspace, water is the dominant matrix component competing for membrane permeation and capillary transport, and drives the multi-minute equilibration times documented for MIMS systems (the miniRUEDI literature reports ~20 minutes of stabilization specifically attributed to H2O persistence after switching inlet gas streams) [21].
Co-evolved gases (CH4, CO2, H2S, He, N2, CO). The linear-superposition formalism above in principle handles any number of co-eluting gases, provided their fragmentation patterns and sensitivity factors are known — but in practice this is where field MS analysis gets fragile.
| Gas | Interference issue |
|---|---|
| CO | CO shares mass 28 with N2 (and with the 28 fragment of CO2), a classic ambiguity resolved only by comparing the ratio of 28 to 12 (C⁺) or 44 (CO2⁺) fragments, not by mass 28 alone. |
| CH4 | CH4’s cracking pattern (15, 16, 17 amu) can tail into adjacent low-mass channels. |
| H2S | H2S (34 amu, with 33 and 32 fragments) is chemically corrosive to hot filaments and, at high concentration, can poison a tungsten or even a thoria-iridium filament — SRS specifically selects oxidation-resistant thoria-coated iridium filament wire for atmosphere-tolerant, longer service life, but this is a durability choice, not immunity to sulfur poisoning at sustained high H2S loading [1]. |
| He | For this dossier, He (m/z 4) sits directly adjacent, in nominal-mass terms, to D2⁺ and HT⁺, so any deuterated-hydrogen signal in a sample with high He background requires resolving power the quadrupole does not have — a limitation that matters specifically when He-isotope and H-isotope companion measurements are attempted on the same low-resolution instrument. |
Fouling/poisoning of pumps and detectors. Turbomolecular and diaphragm pump backstreaming, and any siloxane/silicone vapor in the sampled gas, are recognized long-term contamination sources for quadrupole rod sets and, especially, for continuous-dynode electron multipliers — organic/oil contamination and exposure to reactive gases are explicitly flagged in the SRS manual as drivers of accelerated gain degradation, “particularly serious just after the detector has been exposed to air, or after high quantities of reactive gases have been introduced into the vacuum system” [1].
Gain degradation is cumulative with accumulated output charge (onset “typically at accumulated output current values of a few thousand µAmp-hr”) and ultimately requires CDEM replacement — a real, serviceable consumable-lifetime limitation absent from optical/electrochemical sensing modalities [1].
Drift and calibration burden. Because sensitivity factors are gas-, instrument-, and settings-specific, and because both filament emission efficiency and multiplier gain drift with time and exposure history, quantitative MS work — unlike a factory-calibrated electrochemical cell — assumes an ongoing in-house calibration practice: periodic pure-gas sensitivity checks, periodic Faraday-cup/CDEM cross-calibration, and, for isotope work, frequent reference-gas bracketing against VSMOW-traceable standards [1][31]. See calibration & QA/QC for how this compares across sensing modalities.
Use for geologic H2
Section titled “Use for geologic H2”Soil-gas surveys
Section titled “Soil-gas surveys”Portable field electrochemical and thermal-conductivity meters (Geotech GA2000/GA5000/BIOGAS5000, Variotec 460 Tracergas) — not mass spectrometers — are the instruments actually named in the current natural-hydrogen soil-gas survey literature for routine point and continuous-monitoring measurements, spanning roughly 0–1000 ppmv up to 0–100 vol% H2 [24][33].
MS’s role in soil-gas work is as the confirmatory/isotopic laboratory backstop: samples collected in the field (vials or evacuated containers) are shipped to a laboratory GC-IRMS or GC-MS for δD-H2, δ¹³C-CH4, and noble-gas-isotope analysis to distinguish biogenic, thermogenic, and abiotic/radiolytic/serpentinization sources — a workflow explicitly laid out in the STET review of natural-H2 exploration tools [24]. True field-deployable MS for soil gas (MIMS or portable ion-trap) exists in the literature and on the commercial fringe but is not, as of the sources reviewed, a mainstream soil-gas-survey tool for H2 specifically — it is more often deployed for dissolved gas in water samples collected during a soil-gas or hydrogeological campaign (below) [12][19][20]. See soil gas surveys for the frontline instruments this page backstops.
Dissolved H2 in groundwater — MIMS’s clearest fit
Section titled “Dissolved H2 in groundwater — MIMS’s clearest fit”This is the best-supported use case for field/lab MS in this domain. MIMS instruments (lab-grade Hiden HPR-40 DSA; field-portable, autonomous groundwater-MIMS units built on the same PDMS-membrane principle) directly and quantitatively measure dissolved permanent gases including He, Ar, N2, O2 in groundwater with sub-4% precision for He/Kr and ~1% for Ar/N2/O2 at quasi-continuous (every ~12 minutes) sampling intervals, without requiring headspace equilibration or offline extraction [17][18].
Because dissolved H2 in groundwater is a recognized indicator of subsurface redox conditions, microbial activity, and — in the geologic-hydrogen context — of active gas migration into the shallow aquifer, MIMS is the best-matched MS technology in this dossier for a specific need: continuous, on-site, minimally invasive dissolved-H2 (and companion dissolved-He) monitoring in monitoring wells.
Published groundwater-MIMS validation work to date emphasizes He/Ar/N2/O2/Kr, not H2 explicitly — H2’s low RSF, its interference-prone m/z = 2 position, and its high diffusivity (fast membrane permeation, but also fast loss/equilibration with atmosphere during sampling) mean a MIMS system intended for quantitative dissolved-H2 work needs its own dedicated calibration campaign against known H2-spiked water standards before field deployment — a genuine, not yet closed, methodological gap to scope directly with a MIMS vendor. See Dissolved gas in groundwater for the aqueous-phase sampling context and instrument landscape this MIMS use case sits within.
Downhole logging — not feasible
Section titled “Downhole logging — not feasible”No source reviewed describes, or even proposes, a mass spectrometer deployed in a borehole. Every instrument class here (RGA, QMS, MIMS, IRMS, noble-gas MS) is a bench or transportable surface instrument requiring a stable vacuum system, an electron-impact or equivalent ion source, and — for anything beyond a Faraday cup — a high-voltage detector, none of which tolerates high downhole temperature/pressure, none of which is designed to run unattended and untethered at depth, and all of which need periodic recalibration and consumable service (filaments, CDEM) that is impossible downhole.
The correct and universally practiced architecture is: collect gas or fluid downhole using conventional sampling tools (drill-stem tests, U-tube samplers, mud-gas traps, sealed bailers) and bring the sample to a surface- or laboratory-based MS — exactly the model used in mud-gas isotope logging, where the analytical instrumentation lives in a rig-site cabin/skid and is fed by a continuous mud-gas extraction line, not by anything placed in the wellbore itself [26][27][28]. This reinforces, rather than contradicts, the “zero downhole electronics” design philosophy documented on the downhole deployment page; MS is unambiguously a surface/laboratory technique for the foreseeable future.
Continuous monitoring stations
Section titled “Continuous monitoring stations”Field evidence (a Perth Basin/Harvey soil-gas comparison study) shows that repeat point surveys with portable electrochemical analyzers capture the overall range of H2 emissions but miss abrupt, transient flux pulses (up to 598 ppm observed) driven by temperature, pressure, and soil-moisture changes — arguing for continuous, unattended monitoring [33].
MS is not the continuous-monitoring workhorse here (power, size, consumable, and cost burdens are all wrong for a low-maintenance unattended station), but a MIMS or transportable QMS unit could serve as a periodic ground-truth recalibration reference for a network of cheaper continuous electrochemical/MOx stations, and as the platform for capturing occasional isotope samples during high-flux transient events identified by the continuous network. See environmental covariance for the broader argument for continuous monitoring.
Mud-logging / active drilling
Section titled “Mud-logging / active drilling”Real-time wellsite MS (mud-logging GC-MS, and its isotope-resolving cousin GC-C-IRMS/MGIL) is an established, commercially available service in oil & gas drilling and is being explicitly adapted for natural-hydrogen exploration: current SPE literature discusses calibrating mud-logging GC-MS systems to reliably quantify H2 below 5 ppm, flags cavity-enhanced Raman spectroscopy as a complementary technique under evaluation, and flags artificial H2 generation from oil-based drilling mud as a major interpretive hazard, recommending cross-checking against alkene and CO concentrations to distinguish genuine formation H2 from drilling-induced H2 [26].
Any drilling campaign using oil-based mud should budget for this specific confound regardless of which gas-detection technology is used at the wellsite. See mud gas logging.
Summary. MS fills three roles:
- the reference-truth laboratory technique for confirmatory gas composition and, especially, isotopic fingerprinting (δD-H2, companion δ¹³C-CH4, He-isotope R/Ra) that no field electrochemical or optical sensor can provide
- a strong, if under-validated-for-H2-specifically, candidate for continuous dissolved-gas monitoring in groundwater wells via MIMS
- a mature, commercially available wellsite mud-gas service with an active push toward H2-specific calibration
It is not, and should not be expected to become in the near term, a routine soil-gas-survey or downhole-deployed sensing technology. See why H2 is hard and geologic context for the exploration-side framing of these constraints.
Vendors & products
Section titled “Vendors & products”| Vendor | Product line / model | Category | Key specs (as sourced) | Price class | Ref |
|---|---|---|---|---|---|
| Stanford Research Systems (SRS) | RGA100 / RGA200 / RGA300 | Lab QMS/RGA | Mass range 1–100/200/300 amu; ΔM₁₀%<0.5 amu; sensitivity 2×10⁻⁴ A/Torr (FC); MDPP 5×10⁻¹¹ Torr (FC), 5×10⁻¹⁴ Torr (CDEM opt.); thoria-Ir dual filament | List ~US $4,950 (RGA100 base, historical pricing, unverified current) | [1] |
| Hiden Analytical | QGA / QGA 2.0 | Process/transportable QMS | Based on HAL 201 RC quadrupole; mass range 1–200 amu; 100 ppb–100% dynamic range; up to 1000 meas/s; H2-compatible vacuum system (QGA 2.0) | Quote-only (unverified) | [13][14] |
| Hiden Analytical | HPR-40 DSA / DEMS | Membrane-inlet MS (MIMS) | Mass range 1–200/300 amu; sensitivity 100%–60 ppt (species-dependent); up to 650 meas/s; dual Faraday/Channeltron detector; PDMS membrane probe/flow-through/DEMS-cell inlets; 1.2 kVA, ~33 kg + 7 kg pump | Quote-only (unverified) | [12] |
| Pfeiffer Vacuum | OmniStar GSD 320 (process gas) / ThermoStar GSD 320 (TGA off-gas) | Process/transportable QMS | Mass range 1–100/200/300 amu; detection limit <1 ppm (C-SEM), <40 ppm (Faraday); heated capillary inlet to 200–350 °C | Quote-only (unverified) | [15][16] |
| Gasometrix (spin-off of Eawag) | miniRUEDI | Field-portable MIMS | Base gas suite He/Ne/Ar/Kr/N2/O2/CO2 (extended methods for CH4, H2S, H2 per vendor); ΔM≤0.5 amu; 50 W; 32 kg incl. case; battery/solar-capable | Quote-only (unverified) | [19][20][21] |
| University of Florida / NASA KSC (Ottens et al.) | Custom buffer-gas-free quadrupole ion-trap MS | Research portable MS | Mass range 2–50 Da; DL <25 ppm H2, <100 ppm He; built for Space-Shuttle cryogenic-fuel-leak monitoring | Research prototype, not commercial | [10] |
| 908 Devices | MX908 / M908 | Handheld MS (context, not H2-validated) | High-pressure MS (>1 Torr), ion-trap array, ambient ionization; ~2 kg, hours of battery life; explosives/narcotics/CWA focus | Commercial, no H2 capability found | [11] |
| Inficon | HAPSITE | Handheld GC/MS (context) | Battery-portable GC/MS with library matching; general VOC/CWA focus | Commercial, no H2 capability found | [11] |
| Thermo Fisher Scientific | Delta series IRMS (e.g., Delta V) + TC/EA front end | IRMS for δD-H2 | H/D, ¹³C/¹²C, ¹⁵N/¹⁴N, ¹⁸O/¹⁶O, ³⁴S/³²S ratio capability; δD precision ~±2‰ (2σ) via TC/EA | Quote-only (unverified); high-capex lab instrument | [22][31][32] |
| Thermo Fisher Scientific | ”Helix”-family noble-gas MS (referenced generically) | Noble-gas/He-isotope MS | Static-vacuum magnetic sector; Faraday cups (⁴He, ²⁰Ne, ⁴⁰Ar) + electron multiplier (³He, Kr, Xe) | Quote-only (unverified) | [30] |
| Various oilfield service companies | Mud Gas Isotope Logging (MGIL) skids — GC-MS / GC-C-IRMS | Wellsite mud-logging MS | δ¹³C (methane–pentane) and δ²H (methane/ethane/propane) at rig-site, near-real-time; H2 quantification calibration target <5 ppm | Day-rate contracted service (unverified $) | [26][27][28] |
Open questions
Section titled “Open questions”- No source reviewed gives a dedicated, validated H2-in-groundwater calibration for any commercial MIMS unit. Published MIMS groundwater validation emphasizes He/Ar/N2/O2/Kr; before proposing MIMS for continuous dissolved-H2 monitoring at a Hestia site, commission (or request from Hiden/Gasometrix) an explicit H2-spiked-water calibration curve and a quantified detection limit, not an extrapolation from the He/Ar numbers.
- Confirm current, quotable pricing for the Hiden HPR-40 DSA, Hiden QGA/QGA 2.0, Pfeiffer OmniStar/ThermoStar, and a Thermo Delta-series IRMS + TC/EA system — every price other than the SRS RGA100 list figure here is marked unverified and needs a direct vendor quote before budget planning.
- Resolve the exact resolving power needed, and instrument options that provide it, for a routine (non-fusion-lab) geologic-H2 isotope workflow that wants to separate H2 from trace D/HD contamination at m/z 2–3 without resorting to a full magnetic-sector IRMS for every sample — is a “corrected quadrupole” approach [8][9] accurate enough for exploration-grade δD-H2, or does every sample really need TC/EA-IRMS?
- Quantify the true field H2 background/detection floor for a MIMS or transportable QMS system, accounting for the instrument’s own outgassing/permeation H2 contribution — none of the vendor literature reviewed gives an H2-specific noise floor distinct from the generic multi-gas MDPP/sensitivity numbers.
- Chase down whether any vendor now sells a turnkey, H2-specific portable/handheld MS beyond the 2002-era NASA research prototype — the miniature-MS review used here is from 2017 and the field moves quickly; a fresh literature/vendor sweep (2024–2026) focused specifically on “handheld mass spectrometer hydrogen” is warranted before concluding the category is a dead end.
- Get a named, sourced day-rate or contract-cost figure for a mud-gas isotope logging (MGIL) service adapted for H2, and confirm which service companies (not just the generic SPE papers) currently offer H2-calibrated mud-gas GC-MS at the wellsite.
- Verify the H3+/HD+/T+ isobar interference claims against a primary tritium-plant or fusion-fuel-cycle QMS paper with full text access — both ScienceDirect papers cited here were only accessible via abstract/search-snippet in this research pass; a subscription or interlibrary-loan pull of [8] and [9] in full would let the wiki state exact correction-factor magnitudes rather than qualitative interference statements.
Related pages
Section titled “Related pages”- Why H2 is hard
- Gas chromatography
- Mud gas logging
- Geologic context
- Soil gas surveys
- Downhole deployment
- Calibration & QA/QC
- Environmental covariance
- Electrochemical cells
- Raman spectroscopy
- Isotopes & fingerprinting — the field source-attribution framework built on the δD/δ¹³C/He-isotope measurements this page’s IRMS and noble-gas MS sections develop
- Dissolved gas in groundwater — the aqueous-phase monitoring-well use case this page’s MIMS section identifies as its clearest fit
References
Section titled “References”Full reference list (34 entries)
- Stanford Research Systems, “Models RGA100, RGA200, and RGA300 Residual Gas Analyzer: Operating Manual and Programming Reference,” Rev. 1.8 (2009). https://www.thinksrs.com/downloads/pdfs/manuals/RGAm.pdf
- Stanford Research Systems, “Gas Correction Factors for Bayard-Alpert Ionization Gauges,” Application Note. https://www.thinksrs.com/downloads/pdfs/applicationnotes/IG1BAgasapp.pdf
- R. L. Summers, “Empirical Observations on the Sensitivity of Hot Cathode Ionization Type Vacuum Gauges,” NASA Technical Report NASA-TN-D-5285 (1969), as cited/tabulated in [2].
- D. Rapp and P. Englander-Golden, “Total Cross Sections for Ionization and Attachment in Gases by Electron Impact. I. Positive Ionization,” J. Chem. Phys. 43, 1464 (1965). https://dydaktyka.fizyka.umk.pl/Karwasz/H2O/Biblio/Rappa%20D,%20Englander-Golden%20P.,%20Journal%20Chemical%20Physics%2043%20(1965)%201464.pdf
- NIST, “BEB Electron-Impact Ionization Cross Section Graph for Hydrogen Molecule (H2),” Electron-Impact Cross Sections for Ionization and Excitation Database. https://physics.nist.gov/cgi-bin/Ionization/graph_new.pl?element=H2.0
- “Ionization Cross Sections of Hydrogen Molecule by Electron and Positron Impact,” PMC10970707. https://www.ncbi.nlm.nih.gov/pmc/articles/PMC10970707/
- “A Quadrupole Mass Spectrometer for Resolution of Low Mass Isotopes,” University of Liverpool Mass Spectrometry (preprint/reprint PDF); abstract at ScienceDirect. https://www.liverpool.ac.uk/media/livacuk/massspectrometry/pdfs/A,quadrupole,mass,spectrometer,for,resolution,of,low,mass,isotopes.pdf; https://www.sciencedirect.com/science/article/pii/S1044030510002588
- “New method for calibration of a quadrupole mass spectrometer for hydrogen isotopes measurements,” Fusion Engineering and Design (2021). https://www.sciencedirect.com/science/article/abs/pii/S0920379621000508
- “Quantitative analysis of hydrogen isotope gas mixtures by low resolution quadrupole mass spectrometer” (2023). https://www.sciencedirect.com/science/article/abs/pii/S1387380623000167
- A. K. Ottens, W. W. Harrison, T. P. Griffin, W. R. Helms, “Real-Time Quantitative Analysis of H2, He, O2, and Ar by Quadrupole Ion Trap Mass Spectrometry,” Analytical Chemistry (2002). https://pubmed.ncbi.nlm.nih.gov/12322959/
- “Miniature and Fieldable Mass Spectrometers: Recent Advances,” PMC5364034. https://pmc.ncbi.nlm.nih.gov/articles/PMC5364034/
- Hiden Analytical, “HPR-40 DSA: Membrane Inlet Mass Spectrometers for Dissolved Species Analysis,” Brochure TDS 171/3. https://hideninc.com/wp-content/uploads/2018/10/TDS-171-3_HPR-40-DSA-Brochure-6pp-High-Res.pdf
- Hiden Analytical, “QGA 2.0 — Next Generation Gas Analyser.” https://www.hidenanalytical.com/products/gas-analysis/qga-2-0/
- “Quantitative Gas Analysis with Hiden’s QGA,” AZoCleantech. https://www.azocleantech.com/equipment-details.aspx?EquipID=595
- Pfeiffer Vacuum / Instrument Specialists, “OmniStar / ThermoStar — The New Gas Analysis Systems.” https://instrument-specialists.com/wp-content/uploads/2012/01/OmniStarThermoStar.pdf
- “ThermoStar GSD 320 T2, 1–200 amu” datasheet excerpt. https://www.yumpu.com/en/document/view/38129295/thermostar-gsd-320-t2-1-200-amu
- M. Singleton and G. Hudson, “Membrane Inlet Mass Spectrometry for Measuring Dissolved Gases,” Lawrence Livermore National Laboratory Technical Report, OSTI ID 877829 (2005). https://doi.org/10.2172/877829
- “Membrane Inlet Mass Spectrometer for the Quasi-Continuous On-Site Analysis of Dissolved Gases in Groundwater,” Environmental Science & Technology 46(15), 8288 (2012). https://pubs.acs.org/doi/10.1021/es3004409; https://pubmed.ncbi.nlm.nih.gov/22775356/
- Gasometrix, “miniRUEDI Portable Mass Spectrometer” (product page). https://gasometrix.com/products/
- M. S. Brennwald et al., “A Portable and Autonomous Mass Spectrometric System for On-Site Environmental Gas Analysis,” Environmental Science & Technology 50(24), 13455 (2016). https://pubs.acs.org/doi/abs/10.1021/acs.est.6b03669
- “Deconvolution and compensation of mass spectrometric overlap interferences with the miniRUEDI portable mass spectrometer,” PMC7490835 (2020). https://pmc.ncbi.nlm.nih.gov/articles/PMC7490835/
- “Natural isotope fingerprinting of produced hydrogen and its potential applications to the hydrogen economy,” International Journal of Hydrogen Energy (2024). https://www.sciencedirect.com/science/article/pii/S0360319924013338
- A. V. Milkov, “Molecular hydrogen in surface and subsurface natural gases: Abundance, origins and ideas for deliberate exploration,” Earth-Science Reviews 230, 104063 (2022). https://www.sciencedirect.com/science/article/abs/pii/S0012825222001477
- “Natural H2 exploration: tools and workflows to characterize a play,” Science and Technology for Energy Transition (STET) (2023). https://www.stet-review.org/articles/stet/full_html/2023/01/stet20230116/stet20230116.html
- A. Prinzhofer et al., “Discovery of a large accumulation of natural hydrogen in Bourakebougou (Mali),” International Journal of Hydrogen Energy 43(42), 19315 (2018). https://f.hubspotusercontent20.net/hubfs/6147377/HNAT/CONTENTS/2018_prinzhofer_mali.pdf
- “Advanced Mud Gas Logging Techniques for Hydrogen Exploration,” SPE Middle East Oil and Gas Show and Conference (2025). https://onepetro.org/SPEMEOS/proceedings-abstract/25MEOS/25MEOS/D011S018R002/790177
- “Mud gas isotope logging (MGIL) assists in oil and gas drilling operations,” Oil & Gas Journal. https://www.ogj.com/general-interest/companies/article/17239875/mud-gas-isotope-logging-mgil-assists-in-oil-and-gas-drilling-operations
- “Quality Isotope Analysis at the Wellsite: Two Case Studies that Validate GC-C-IRMS Mud Gas Isotope Logging for Deepwater Exploration and Development,” SPE Annual Technical Conference and Exhibition (2022). https://onepetro.org/SPEATCE/proceedings-abstract/22ATCE/2-22ATCE/509307
- USGS Groundwater Dating Laboratory, “3H/3He Dating Background.” https://water.usgs.gov/lab/3h3he/background/
- “Optimizing Helium Exploration: Noble Gas Isotopes as Probes for Migration–Enrichment Processes,” Energies 18(16), 4218 (2025). https://www.mdpi.com/1996-1073/18/16/4218
- Thermo Fisher Scientific, “Gas Isotope Ratio Mass Spectrometry (IRMS).” https://www.thermofisher.com/us/en/home/industrial/mass-spectrometry/isotope-ratio-mass-spectrometry-irms/gas-isotope-ratio-mass-spectrometry-irms.html
- Thermo Fisher Scientific, Application Note AN30180, “EA-IRMS: Fast and Precise Isotope Analysis of Liquids.” https://documents.thermofisher.com/TFS-Assets/CMD/Application-Notes/AN30180-Isotope-Analysis-on-DELTA-V-Isotope-Ratio-MS-EN.pdf
- “Natural hydrogen soil gas emissions near Harvey, Perth Basin: a comparative study of survey methods,” Science and Technology for Energy Transition (STET) (2025). https://www.stet-review.org/articles/stet/full_html/2025/01/stet20250031/stet20250031.html
- “Short-term variability of atmospheric helium revealed through a cryo-enrichment method,” Atmospheric Measurement Techniques 16, 1551 (2023). https://amt.copernicus.org/articles/16/1551/2023/ (supports the 5.24 ppmv Glückauf figure; does not support the 5.222 ± 0.017 ppmv isotope-dilution figure also cited on this page)