Palladium resistive & nanomaterial sensors
Summary
Section titled “Summary”Palladium splits H2 at its surface, dissolves the hydrogen atoms into its crystal lattice, and swells several percent while doing so. It does this at room temperature, in air or without any oxygen at all. Resistive and nanomaterial Pd sensors convert that absorption into an electrical reading: in a continuous film the dissolved hydrogen raises resistance, while in deliberately discontinuous designs (nanowires with break junctions, nanoparticle films near percolation) the swelling closes gaps and resistance falls sharply. Because nothing is burned, this is the one major H2-sensing family that works with no oxygen present, which matters for anoxic soil gas and nitrogen-purged wellbore samples.
Two limits. First, the only vendor shipping mature Pd resistive hardware (H2scan) tunes it for industrial safety concentrations, hundreds of ppm to 100% H2, not the low-ppm anomalies Hestia wants to map; the laboratory devices that reach parts-per-billion are bench-top science, not field instruments. Second, hydrogen sulfide, which commonly accompanies natural hydrogen seeps, poisons the same Pd surface the sensor depends on.
At a glance — published performance envelope
- Detection limit
- 0.04–5,000 ppm
- Range
- 0.04–1,000,000 ppm
- Response t90
- 0.02–90 s
- Recovery
- 1–1,500 s
- Selectivity
- high
- Drift
- medium
- Operating T
- −40 … 150 °C
- Humidity
- 0–95 % RH
- Power
- 0.0001 mW – 10 W
- Unit cost
- ≥ $5
- TRL
- 9
Main interferents: CO, H₂S, O₂, D2 · poisons: H₂S, CO, SO₂. Ranges span the published devices/variants covered below — per-claim citations are in the body; data: src/data/modalities/palladium-resistive.yaml.
How it works
Section titled “How it works”Palladium is the only elemental metal that combines fast catalytic H2 dissociation, high solubility for atomic hydrogen, and fast bulk diffusion, all near room temperature [1][3]. The surface reaction is dissociative chemisorption,
followed by absorption into interstitial lattice sites. At low loading the equilibrium H/Pd ratio obeys Sieverts’ law:
H2scan’s commercial PdNi chemiresistor operates on exactly this: resistivity rises in proportion to the square root of hydrogen partial pressure [1]. Calibration is therefore inherently nonlinear, and firmware that converts resistance to concentration must apply a square-root transform, not a straight line.
Phase transition. Above roughly at room temperature, Pd-H converts from the dilute α phase to the β hydride, a first-order transition with a critical point near , MPa, [1][25]. At room temperature the two-phase plateau sits at only ≈20–30 mbar of H2 partial pressure [1], a few percent of one atmosphere, so percent-level H2 already nucleates the hydride and brings the hysteresis and embrittlement described below. Phase-boundary compositions: α-phase maximum , β-phase minimum on absorption [1][23].
Lattice expansion. The lattice constant grows from 3.889 Å in the α phase (at ) to 4.025 Å in the β phase [5], a 3.5% linear and roughly 11% volumetric expansion. That strain is the working principle of every nanogap and percolation sensor below, and the root cause of hydrogen embrittlement from repeated α↔β cycling [1].
Resistance response. In bulk PdH, climbs to ≈1.52 at the α/β absorption boundary, ≈1.57 on desorption, and peaks near 1.87 at [23][24]. That roughly 1.8× ceiling is the mechanism H2scan’s Pd-Ni chemiresistor exploits [9][11][14]. Nanostructuring flips the sign: in a discontinuous film or nanowire array, swelling closes inter-element gaps and resistance can drop by orders of magnitude near the percolation threshold [1][2][4], which is why nanogap and percolation devices report large signal-to-noise and sub-second response. The sign also depends on environment: in air the resistivity-raising hydride mechanism can dominate even in nominally discontinuous films, while in N2 or vacuum the geometric mechanism wins [2].
Hysteresis. Because the transition is first order, the absorption plateau pressure sits above the desorption plateau at any sub-critical temperature. This is thermodynamic, not kinetic; it narrows toward and vanishes above it [1][25], and in nanostructured Pd it disappears below a critical particle size (~3 nm at 30 °C reported) [1]. An unalloyed Pd sensor therefore reads differently depending on whether the concentration was rising or falling, which is unacceptable for quantitative logging unless suppressed by alloying or by staying below roughly 1–2 vol %.
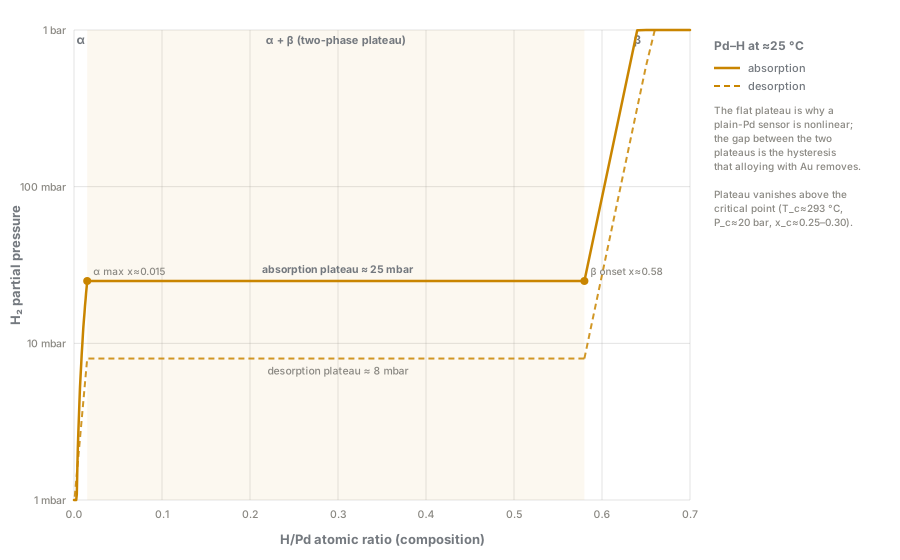
The flat plateau is why plain Pd is nonlinear (one pressure spans a huge composition range); the gap between absorption and desorption plateaus is the hysteresis that alloying with ~25 at% Au removes by pushing the critical point below room temperature.
Device classes
Section titled “Device classes”- Bulk/thick Pd(-alloy) film. A continuous sputtered, evaporated, or plated resistor. Resistance rises with H2; response is diffusion-limited by thickness; fully exposed to hysteresis, embrittlement, and delamination unless alloyed or mounted on a compliant layer [1].
- Mesowire arrays (Penner lineage). Pd electrodeposited along graphite step edges into wire arrays with natural break junctions. Grain dilation closes the gaps, so resistance falls, with millisecond-to-seconds response over 2–10 vol % in the founding 2001 Science paper [4].
- Nanogap switches. An engineered nanoscale gap between Pd(-alloy) electrodes that swelling closes discontinuously. Uniform 15 nm gaps in a Pd-Au nanoribbon array gave stable switching across 0.005–10% H2, a 27 ppm limit of detection, and seven months of ambient storage [18].
- Nanoparticle / percolation films. A discontinuous film just below the percolation threshold that hydrogenation nudges across it. Best reported LODs: 0.2 ppm (Pd on graphene, N2, room temperature) and 0.5 ppm (Pd on ZnO nanorods) [2]. The 2025 state of the art, a fullerene-buffered PdCo nano-resistor network with a Teflon-AF overlayer, measured 40 ppb LOD with 0.40 s response and 16 s recovery at room temperature [16].
- Polymer overlayers. A 3–50 nm PTFE/Teflon-AF or PMMA topcoat passes H2 and screens larger molecules. A 30 nm PTFE coat tolerated 30,000 ppm CO2, 1000 ppm CO, and 100 ppm NO2 with modest perturbation [1]; the PdCo sensor’s separate 50 nm PMMA coat held CO2 and CH4 cross-signal to ±4% at 5% background each [16]. Overly thick coatings slow response [1].
- Commercial hybrid. H2scan’s ASIC pairs a work-function element for low ppm (described as Lundström-type, unverified) with a Pd-Ni chemiresistor for percent-level, each temperature- and pressure-compensated on chip [14]. The work-function half is covered under work-function devices.
Alloying is the main engineering lever: it pushes the α→β transition above the operating range or removes it, trading some sensitivity for freedom from hysteresis and embrittlement.
| Alloy | Role | Key result | Ref |
|---|---|---|---|
| Pd-Ni | Commercial workhorse (H2scan) | Ni ≥8 at% suppresses the phase change entirely up to 630 Torr; 5.3 at% still transitions near 250 Torr | [7][8] |
| Pd-Au | Fast, wide-range nanodevices | ≥25 at% Au holds hysteresis below 5% uncertainty over 1–1000 mbar [1]; liability is a slow-forming Pd(O)Au surface oxide that ages response speed, reversible by H2-refresh anneal or prevented by O2-plasma pretreatment [19] | [1][18][19] |
| Pd-Ag | Higher H solubility | Pd75Ag25 foils; common in fiber-optic/FBG coatings and some resistive films | — |
| Pd-Cu | CO resistance | ~5 at% Cu essentially eliminates CO poisoning at 5000 ppm CO in air | [1] |
| Pd-Co | Kinetics; current LOD record | Used in the fullerene-buffered network above; reduced hysteresis at nanoscale | [16] |
Performance envelope
Section titled “Performance envelope”Numbers are as reported in the cited sources; “commercial” rows are shipping products, everything else is laboratory/demonstration TRL.
| Device class | LOD | Demonstrated range | Response | Recovery | Selectivity notes | Op. temp | Ref |
|---|---|---|---|---|---|---|---|
| Bulk/thick Pd film chemiresistor | ~0.1–1 vol % (unalloyed, order of magnitude) | 0–100% | seconds–tens of s | seconds–tens of s | High vs. inert gases; hysteresis-prone | RT–150 °C tested | [1] |
| Pd mesowire array (electrodeposited, Penner) | not LOD-optimized originally | 2–10 vol % (original); 0.005–10% with later alloying | 20 ms – 5 s, concentration-dependent | comparable | High; sign-inverted (R↓) | RT | [4] |
| Pd-Au nanoribbon, 15 nm engineered nanogap | ≈0.0027% (27 ppm) | 0.005–10 vol % | sub-second | stable ≥7 months storage | High; alloy suppresses hysteresis | RT | [18] |
| Pd nanoparticle/graphene percolation film | 0.2 ppm (best case, N2, RT) | ppm–% | 0.7 s at 2.2% (best case) | comparable | Air vs. N2 changes response sign/magnitude | RT | [2] |
| Pd nanoparticle/ZnO nanorod film | 0.5 ppm | ppm–% | seconds | seconds | — | RT | [2] |
| Fullerene-buffered PdCo nano-resistor network (2025 SOTA) | 40 ppb measured; 100 ppt extrapolated | 1–100 mbar H2 (≈0.1–10%) | 0.40 ± 0.06 s | 16 ± 1 s | CO2/CH4 (5%): ±4%; CO (0.2%): ±3 s kinetic shift; 40–90% RH: 87–91% signal retained; <5% drift/100 cycles | RT (25 °C) | [16] |
| Pd-Ni thin film (Sandia composition study) | — | 10⁻³–700 Torr H2 studied | fast, alloy-tunable | fast | Ni ≥8 at% removes phase transition to 630 Torr | ambient | [7][8] |
| Pd nanowire, thermally refreshed (wireless node) | — | 0.1–4% | <25 s fresh; ≥40 s after 7-day contamination | restored by 200 °C/10 min refresh | CO2 surface poisoning is main long-term drift driver | RT op., 200 °C refresh | [17] |
| H2scan HY-OPTIMA 5030 series (commercial) | 0.03–0.5% (model-dependent) | 0–5%, 0–10%, or 0–100% (model-dependent) | <60–90 s (T90) | comparable | ”No cross-sensitivity” claimed; model-dependent CO/H2S tolerance | −40 to 60 °C process gas | [9] |
| H2scan HY-ALERTA area monitors (commercial) | detection from ~4000 ppm (10% LEL) | 4000 ppm–5% (10–125% LEL) | seconds–minutes | — | Selective for H2; degraded by high CO/H2S/O2 | 10-yr rated outdoor life | [11][15] |
Scalar figures worth carrying into selection discussions:
- DOE hydrogen-sensor targets (industry benchmark): detect 0.5% H2 in air or better, response <1 s, operate −30 to 80 °C, ≤5% accuracy, unit cost ≈$5 sensor / $30 controller [6].
- Power: bare nanoscale elements run at 1–100 nW [1]; a complete H2scan HY-OPTIMA analyzer specifies 12–30 VDC at 10 W [9]. The gap is electronics and comms overhead, not sensor physics.
- Lifetime: H2scan claims 10+ years with no field recalibration via a patented auto-calibration routine [11]; unprotected nanomaterial devices can degrade >200% in response time within 7 days of ambient exposure, recoverable by thermal refresh [17].
- Resistivity ceiling: bulk PdHₓ peaks near 1.87 at [24].
- Cost: chip-level elements are cheap to fabricate [1], consistent with DOE’s $5–40/unit targets [6]; complete ruggedized analyzers sit in an unpublished, quote-required price tier.
Figures of merit
Section titled “Figures of merit”Specializations of the universal set defined on the Figures of merit page; units follow Concentration units.
Figures-of-merit table for this modality (12 rows)
| Figure of merit | Symbol / formula | Value for this family | How to read it |
|---|---|---|---|
| Sensitivity | ; low loading follows | No single vendor-quoted slope; response is proportional to at low loading, then compressive approaching the α→β transition [1] | Back-calculating concentration needs a square-root (Sieverts-corrected) transform; linear interpolation is wrong near the transition. |
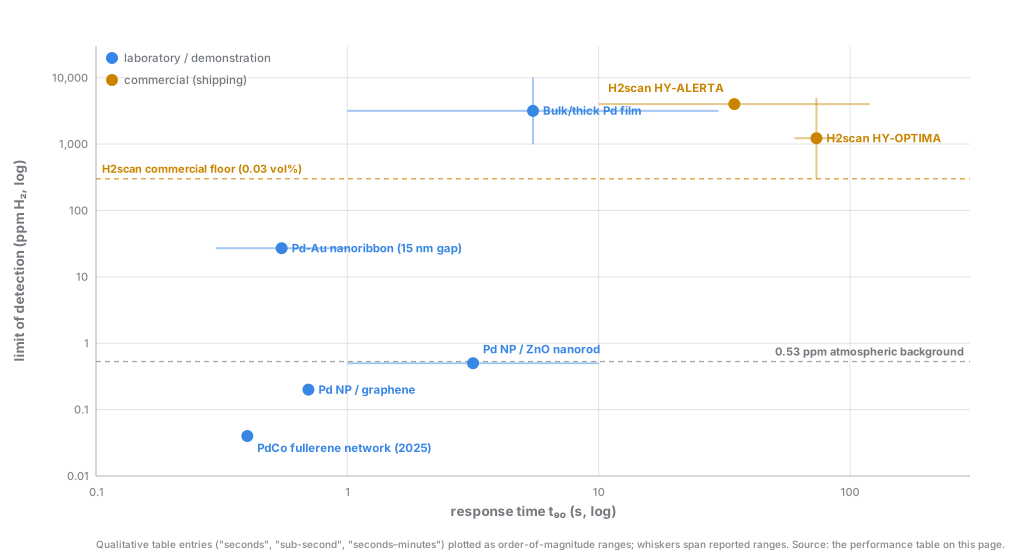
| Limit of detection (LOD) | Spans four decades: 40 ppb measured / 100 ppt extrapolated (PdCo network) [16]; 0.2–0.5 ppm (percolation films) [2]; ≈27 ppm (Pd-Au nanogap) [18]; 300–5,000 ppm (H2scan commercial) [9] | The sub-ppm laboratory figures are reported without a stated averaging time or -convention (unverified); treat as best-case. | |
| Selectivity / cross-sensitivity | Best case: CO2/CH4 held to ±4% at 5% background [16]; He negligible. Worst case: H2S, which chemisorbs on the same Pd sites, only partially reversibly [1][3][27]. CO tolerance is alloy-dependent, 0 ppm to 20% across H2scan models [9] | Design around the worst co-located gas, which for Hestia’s seep settings is H2S. | |
| Response / recovery time | 0.40 s / 16 s recovery (2025 PdCo) [16]; T90 <60–90 s (H2scan) [9]; degrades to ≥40 s after 7 days of ambient contamination without thermal refresh [17] | Sub-second numbers come from TRL 3–5 lab devices; the only TRL9 line is one to two orders slower. | |
| Dynamic / linear range | Roughly 3 decades per architecture: 0.005–10% (Pd-Au nanogap) [18]; 0–100% (bulk film, H2scan) [1][9] | One deployed unit covers only its own architecture’s window; commercial units bottom out above exploration-anomaly levels. | |
| Drift / long-term stability | , | H2scan claims 10+ year field life via auto-calibration [9][11] (vendor claim, unverified); unprotected nanomaterial devices degrade >200% in a week [17]; the 2025 PdCo device holds <5% drift over 100 cycles [16] | The spread reflects whether alloying, coatings, and refresh protocols were engineered in, not an inherent property of the class. |
| Power | — | 1–100 nW bare element [1] vs. 12–30 VDC at 10 W complete analyzer [9] | The gap is electronics overhead; a stripped-down field logger could plausibly stay near the element budget. |
| Operating envelope | H2scan compensated: −40 to 60 °C process gas, <95% RH non-condensing, 0.95–1.1 atm recommended (10 atm max) [9]; most lab demonstrations are room temperature only [1][2] | Raw resistance tracks , so elevated-pressure use needs independent pressure compensation. | |
| Fractional resistance change | Bulk film: ≈0.52 at the α/β absorption boundary, ≈0.87 near saturation [23][24]. Nanogap/percolation: same swelling, opposite sign, resistance falls sharply [1][2][4][18] | Meaningless without the architecture: a strong gradual signal in a bulk film, a near-digital switch in a nanogap. | |
| Gauge / response factor | Bulk/thick film: ≈1.5–1.9, rising with concentration [23][24]. Percolation/nanogap: orders-of-magnitude drops reported qualitatively, no single ratio (unverified exact factor) [1][2][4][18] | Only comparable within one architecture class. | |
| α→β plateau pressure | Van’t Hoff: | ≈20–30 mbar H2 at room temperature, bulk unalloyed Pd [1]; critical point , MPa, [1][25] | Below the plateau, calibration is clean; above it, hysteresis and embrittlement begin. Alloying (Pd-Ni ≥8 at%, Pd-Au ≥25 at%) removes it [1][7][8]. |
| Hysteresis width | Absorption/desorption offset in or | ≈0.05 in (1.52 absorbing vs. 1.57 desorbing), bulk PdHₓ [23][24]; vanishes above and below ~3 nm particle size at 30 °C [1] | An unalloyed room-temperature bulk-film reading needs its approach direction recorded, which is why commercial designs alloy it away. |
Cross-sensitivity & environment
Section titled “Cross-sensitivity & environment”| Factor | Effect on a Pd resistive sensor | Design response | Ref |
|---|---|---|---|
| Temperature | Kinetics are thermally activated (60–80 kJ/mol absorption barriers; a 10 K rise roughly doubles speed). The calibration curve itself shifts with T; one Pd/TiO2 hybrid fell from 11.3% to 8.3% sensitivity between 25 and 100 °C | Active compensation, or an alloy validated across the field diurnal/seasonal range. H2scan rated −40 to 60 °C process gas | [1][9] |
| Humidity | Not a poison, but slows and damps response: 3 s (dry N2) vs. 33 s (ambient air) at 0.1% H2 [2]; the PdCo device retained 91% of dry signal at 40% RH, 87% at 90% RH, recoverable on dry purge [16] | Spec is <95% RH non-condensing [9]; condensation in a buried probe housing is a mechanical risk regardless | [2][9][16] |
| Oxygen | Not required. Pellistors, thermal-conductivity, and most electrochemical sensors need O2; Pd resistive sensing operates in inert gas, with verified linear response in He and N2 carriers [13][20] | This is the family’s main differentiator for anoxic soil gas and purged sampling. O2 can still modulate response magnitude/sign in discontinuous nanostructures [2] | [2][13][20] |
| CH4, CO2, He | Minor. Neither CH4 nor CO2 dissociates on Pd at moderate temperature; cross-response ±4% at 5% background each [16]; He negligible | A sourced advantage over MOX chemiresistors, which are broadly hydrocarbon-cross-sensitive | [16] |
| CO | Competes for surface sites; slows response at low ppm, genuine interferent at high concentration. H2scan model tolerance spans 0 ppm to 20% | Pd-Cu alloying (~5 at% Cu) eliminates CO poisoning at 5000 ppm CO [1]; otherwise pick the model for the gas stream | [1][9] |
| H2S | The strongest poison; see below | Scrubber, overlayer, or thermal refresh | [1][3][9][27] |
| Pressure | Signal tracks , so doubling total pressure at fixed vol % shifts the reading by ≈1.41×. H2scan calibrates at 1 atm, requires pressure compensation elsewhere, and caps at 7–10 atm absolute | Downhole use needs independent pressure measurement plus a Sieverts-law correction, or pressure-regulated sample conditioning | [9][11] |
H2S in detail. Hydrogen sulfide chemisorbs on Pd, blocks the sites H2 dissociation needs, and at sufficient exposure forms surface sulfides that are only partially reversible (days at room temperature, minutes at ~200 °C for simple sulfides). Pd is sensitive enough to H2S to serve as an H2S sensor in its own right: Pd-doped porous silicon devices detect near 300 ppb H2S [27]. H2scan quantifies tolerance per model, from 0 ppm (5032) through 20 ppm (5031) and 1000 ppm (5033) to 3% (5034) [9], and its FAQ lists H2S among the gases that can affect performance [11]. Natural-hydrogen seeps are frequently co-located with sulfate-reducing activity or sulfide mineralization, so assume unprotected Pd sensors in such settings will drift low and slow unless an overlayer, scrubber, or thermal-refresh regime is designed in.
Aging. Three documented degradation mechanisms: embrittlement from repeated α↔β volume cycling, mitigated by compliant adhesion layers or alloying [1]; surface oxidation and contamination, including CO2-derived C=O bonds that slow response within days (reversible by a 200 °C / 10 min refresh [17]) and the metastable Pd(O)Au oxide on Pd-Au (reversible or preventable [19]); and catalytic poisoning by H2S or CO as above. H2scan’s answer to all three is its patented auto-calibration scheme, claimed to give 10+ years without field recalibration [9][11][12]. Treat that as a vendor assertion to validate in-house.
Use for geologic H₂
Section titled “Use for geologic H₂”Soil-gas surveys. Best physics fit, poorly served by current hardware. Laboratory LODs (tens of ppb to low ppm [2][16][18]) sit well below the ≈0.53 ppm atmospheric background [26] and the low end of reported anomalies: Perth Basin surveys found 0 to >1000 ppm point values, pulses to 598 ppm, daily means 0–137 ppm, and gradients of >500 ppm within 10 m [21]. But every sub-10-ppm device is TRL 3–5, while H2scan’s shipping detection floors are 300–5000 ppm by model [9], above most of the signal worth mapping. No commercial Pd instrument spans the 1–1000 ppm window; the one published instrument built for exactly that window (MONHyTOR, 0–1000 ppm, 0.1 ppm resolution, ±5% FS, month-scale battery) is electrochemical [22].
Continuous monitoring stations. Second-best fit: O2-independence plus H2scan’s claimed 10-year no-recalibration life [11][15] suit unattended installations, but HY-ALERTA units alarm at safety thresholds (4000 ppm and up, 10–125% LEL [11]), far above exploration baselines. Today this role needs either a custom research-grade sensor (unproven for unattended field service) or another modality, with Pd reserved for the high end or cross-checking.
Downhole logging. No commercial product exists. Three facts frame the R&D case: (1) above the ~292–295 °C critical temperature the hysteresis problem disappears on its own [1], and many candidate reservoirs approach it, but no vendor has validated Pd elements at such temperatures; (2) pressure compensation is unsolved, since even surface analyzers cap at 7–10 atm [9][11], orders of magnitude below wellbore pressure; (3) a two-wire Pd resistor could in principle be read passively from surface with no downhole electronics, an advantage over electrochemical and MOX/pellistor sensors, but no such system has been built and qualified. The near-term electronics-free path is optical: Pd-coated fiber sensors (fiber-optic sensors). Treat downhole Pd resistive sensing as credible R&D, not procurable capability.
Bottom line. Strongest physics match for anoxic and inert-purged sampling in Hestia’s workflow, and the only such family with a mature product line; but that line is a safety instrument sitting two to four orders of magnitude above exploration anomalies, and nothing field-hardened fills the gap. See Why H2 is hard and Geologic context.
Vendors & products
Section titled “Vendors & products”H2scan Corporation is, on current evidence, the dominant and possibly only vendor shipping Pd-alloy resistive hydrogen sensors as catalog products. The technology traces to Sandia’s early-1990s Pd-Ni sensor work (Hughes & Schubert, US Patent 5,279,795 [8], building on the composition study [7]), later licensed and commercialized [12][13]; H2scan cites a 40-patent base [12].
| Product line | Example models | Stated range | LDL / notes | CO / H2S tolerance | Operating envelope | Ref |
|---|---|---|---|---|---|---|
| HY-OPTIMA® 5030 series (Gen 5 in-line process analyzer) | 5031, 5032, 5033, 5034 | 0–10% (5031); 0–5% intermittent-H2 service (5032); 0–100% (5033, 5034) | 0.03–0.5% depending on model; T90 <60–90 s | 5031: 100 ppm CO / 20 ppm H2S; 5032: 0/0; 5033: 100 ppm CO / 1000 ppm H2S; 5034: 20% CO / 3% H2S | −40 to 60 °C process gas, −20 to 70 °C ambient; 0.95–1.1 atm rec. (10 atm max); <95% RH non-condensing | [9] |
| HY-OPTIMA® 5330 IS / Gen 5 (intrinsically safe) | 5330 family | not itemized | self-calibrating, ≥10-year claimed service life | not itemized | intrinsically safe rating for hazardous locations | [10][12] |
| HY-OPTIMA® 700B, 2700, 1700 series | 700B; 2700 (explosion-proof); 1700 (discontinued, ATEX/IS) | in-line, model-dependent | solid-state, non-consumable | not itemized | up to 95% RH, up to 60 °C (1700 series) | [10] |
| HY-ALERTA® area safety monitors | 5020/5021, 1600, 5320 (IS) | 4000 ppm – 5% H2 (10–125% LEL) | fast response; 10-yr sensor warranty, no field calibration | degraded by high CO/H2S/O2 | designed for intermittent H2 in air/O2/inert background | [11][15] |
| GRIDSCAN™ | — | process/DGA-adjacent monitoring | ~15-year expected sensor life claimed | — | — | [11] |
Notes on the wider landscape:
- Sensing element: all H2scan lines use one dual-mechanism ASIC pairing a work-function element (low ppm; “Lundström-type” is unverified) with a Pd-Ni chemiresistor (percent scale), independently temperature- and pressure-compensated [14].
- Automotive and fuel-cell H2 sensing is not Pd resistive: Bosch [30], Sensirion [31], and Posifa [29] build on MEMS thermal conductivity. See thermal conductivity & acoustic sensors.
- The landmark research devices (Penner mesowires [4], Pd-Au nanogap ribbons [18], PdCo fullerene network [16], thermally refreshed wireless nanowire [17]) have no commercial SKU. This is the clearest whitespace relative to Hestia’s ppm-level needs and a candidate for direct engagement with the originating groups.
- Pd-coated fiber-optic sensing is the adjacent, electronics-free variant, reviewed in [28]; see fiber-optic sensors.
Open questions
Section titled “Open questions”- No sourced price for a complete H2scan analyzer; get a quote before publishing anything more specific than “industrial-analyzer price class.”
- Downhole HTHP qualification is an evidence gap. If pursued, mine the high-pressure Pd-membrane/permeation literature for pressure-compensation models and scope a feasibility study with Penner- or Sandia-adjacent labs.
- H2scan’s “10-year, no field recalibration” claim is sourced only to its own marketing [9][11]; find independent validation before repeating it as fact.
- Confirm whether H2scan’s 300 ppm floor (0.03%) can be pushed lower by custom order or firmware, which decides whether the hardware is usable for sub-100-ppm soil-gas work at all.
- A citable numeric Sieverts constant for Pd-H at 25 °C is still missing; needed for a real calibration/back-calculation tool.
- Check for non-H2scan commercial Pd-resistive vendors (Electrical Optical Components Inc. surfaced unconfirmed).
- No sourced manufacturing-cost comparison exists behind the “low cost” claim; needed for a future TCO/selection page.
Related pages
Section titled “Related pages”- Why H2 is hard
- Geologic context
- MOX chemiresistors
- Work-function devices
- Thermal conductivity & acoustic sensors
- Catalytic pellistors
- Electrochemical cells
- Fiber-optic sensors
References
Section titled “References”Full reference list (31 entries)
- Darmadi, I.; Nugroho, F. A. A.; Langhammer, C. “High-Performance Nanostructured Palladium-Based Hydrogen Sensors—Current Limitations and Strategies for Their Mitigation.” ACS Sensors 5(11), 3306–3327 (2020). DOI: 10.1021/acssensors.0c02019. https://pmc.ncbi.nlm.nih.gov/articles/PMC7735785/
- Ndaya, C. C.; Javahiraly, N.; Brioude, A. “Recent Advances in Palladium Nanoparticles-Based Hydrogen Sensors for Leak Detection.” Sensors 19(20), 4478 (2019). DOI: 10.3390/s19204478. https://pmc.ncbi.nlm.nih.gov/articles/PMC6832907/
- Yan, S.; Cao, Y.; Su, Y.; Huang, B.; Chen, C.; Yu, X.; Xu, A.; Wu, T. “Hydrogen Sensors Based on Pd-Based Materials: A Review.” Sensors 25(11), 3402 (2025). DOI: 10.3390/s25113402. https://pmc.ncbi.nlm.nih.gov/articles/PMC12157283/
- Favier, F.; Walter, E. C.; Zach, M. P.; Benter, T.; Penner, R. M. “Hydrogen Sensors and Switches from Electrodeposited Palladium Mesowire Arrays.” Science 293(5538), 2227–2231 (2001). DOI: 10.1126/science.1063189. https://www.science.org/doi/10.1126/science.1063189
- Wikipedia contributors. “Palladium hydride.” Wikipedia, The Free Encyclopedia. https://en.wikipedia.org/wiki/Palladium_hydride (accessed 2026-07-04).
- Wikipedia contributors. “Hydrogen sensor.” Wikipedia, The Free Encyclopedia. https://en.wikipedia.org/wiki/Hydrogen_sensor (accessed 2026-07-04).
- Hughes, R. C.; Schubert, W. K.; Buss, R. J. “Solid-State Hydrogen Sensors Using Palladium-Nickel Alloys: Effect of Alloy Composition on Sensor Response.” Journal of The Electrochemical Society 142(1), 249 (1995). DOI: 10.1149/1.2043887. https://iopscience.iop.org/article/10.1149/1.2043887
- Hughes, R. C.; Schubert, W. K. “Extended range chemical sensing apparatus.” US Patent 5,279,795 (1994). https://patents.google.com/patent/US5279795A/en
- H2scan Corporation. “HY-OPTIMA® 5030 Series In-Line Hydrogen Process Monitor” (product/technical specification page). https://h2scan.com/product/hy-optima-5000/ (accessed 2026-07-04).
- H2scan Corporation. “HY-OPTIMA In-Line Hydrogen Process Monitor” (product-family overview). https://h2scan.com/product-types/hy-optima/ (accessed 2026-07-04).
- H2scan Corporation. “Frequently Asked Questions for H2scan Hydrogen Sensors and Products.” https://h2scan.com/resource-gallery/faqs/ (accessed 2026-07-04).
- H2scan Corporation. “H2scan Introduces Intrinsically Safe Gen 5 Hydrogen Sensor Family for Hazardous Location Applications” (press release). https://h2scan.com/h2scan-introduces-intrinsically-safe-gen-5-hydrogen-sensor-family-for-hazardous-location-applications/
- H2scan Corporation. “Tech Talk: The Future of Nuclear Safety — Innovative Hydrogen Sensors That Work Where Others Fail.” https://h2scan.com/tech-talk-the-future-of-nuclear-safety-innovative-hydrogen-sensors-that-work-where-others-fail/
- H2scan Corporation. “The Principles of Hydrogen Detection in Hydrogen Sensors” / “The Critical Importance of Hydrogen-Based Monitoring Across Utility and Industrial Applications.” https://h2scan.com/the-critical-importance-of-hydrogen-based-monitoring-across-utility-and-industrial-applications/ (does not support the “Lundström-type” work-function terminology attributed to it above)
- H2scan Corporation. “Solid-State Area Hydrogen Monitor HY-ALERTA 5021” (product page). https://h2scan.com/product/hyalerta-hydrogen-monitor/
- Ngo, T. A.; Magar, A. T.; Pham, M. T.; et al. “Fullerene-decorated PdCo nano-resistor network hydrogen sensors with sub-second response and parts-per-billion detection at room temperature.” Nature Communications 17 (2025). DOI: 10.1038/s41467-025-67708-2. https://pmc.ncbi.nlm.nih.gov/articles/PMC12847907/
- Kim, K.-H.; et al. “Long-term reliable wireless H2 gas sensor via repeatable thermal refreshing of palladium nanowire.” Nature Communications 15, 8761 (2024). DOI: 10.1038/s41467-024-53080-0. https://pmc.ncbi.nlm.nih.gov/articles/PMC11479629/
- Pak, Y.; et al. “Highly Stable and Ultrafast Hydrogen Gas Sensor Based on 15 nm Nanogaps Switching in a Palladium–Gold Nanoribbons Array.” Advanced Materials Interfaces (2019). DOI: 10.1002/admi.201801442. https://advanced.onlinelibrary.wiley.com/doi/10.1002/admi.201801442
- Wang, R.; Zhang, X.; et al. “Stabilizing PdAu hydrogen sensors: Mechanistic insights into metastable PdO and dual strategies of refresh and plasma treatment.” Chemical Engineering Journal 514, 163420 (2025). https://www.sciencedirect.com/science/article/abs/pii/S1385894725042548
- Menon, S. K.; Kumar, A.; Mondal, S. “Advancements in hydrogen gas leakage detection sensor technologies and safety measures.” Clean Energy 9(1), 263–277 (2025). DOI: 10.1093/ce/zkae122. https://academic.oup.com/ce/article/9/1/263/7942619
- “Natural hydrogen soil gas emissions near Harvey, Perth Basin: a comparative study of survey methods.” Science and Technology for Energy Transition (STET) (2025). https://www.stet-review.org/articles/stet/full_html/2025/01/stet20250031/stet20250031.html
- “In-soil hydrogen concentration monitoring using MONHyTOR: application for natural hydrogen exploration.” Advances in Geosciences 67, 57 (2025). https://adgeo.copernicus.org/articles/67/57/2025/
- “An explanation of hysteresis of electrical resistance–composition relationship in the Pd–H(D) and Pd alloy–H(D) systems measured by a gas phase method.” International Journal of Hydrogen Energy. https://www.sciencedirect.com/science/article/abs/pii/S0360319914029000
- “Electrical resistivity of PdHx: I. Residual resistivity.” Solid State Communications. https://www.sciencedirect.com/science/article/abs/pii/0038109875902938
- “Interface pinning causes the hysteresis of the hydride…” OSTI technical report (critical-point values). https://www.osti.gov/servlets/purl/1778217
- “H2 in Antarctic firn air: Atmospheric reconstructions and implications for anthropogenic emissions” (background atmospheric H2 context, ~500–550 ppb consistent with 0.53 ppm figure). https://pmc.ncbi.nlm.nih.gov/articles/PMC8433534/
- “Ultrasensitive detection of low-ppm H2S gases based on palladium-doped porous silicon sensors.” https://pmc.ncbi.nlm.nih.gov/articles/PMC9085253/
- “Palladium (Pd) coated fiber optic hydrogen sensors: A review.” Optics & Laser Technology. https://www.sciencedirect.com/science/article/abs/pii/S1369800124011004
- Posifa Technologies. “Hydrogen Sensor for fuel cell and safety applications — PGS1000” (thermal-conductivity type; cited as contrast to Pd-resistive). https://posifatech.com/pgs1000/
- Bosch Mobility. “Sensors for fuel cell-electric systems.” https://www.bosch-mobility.com/en/solutions/powertrain/fuel-cell-electric/sensors-for-fuel-cell-electric-systems/
- Sensirion. “Hydrogen for Fuel Cells sensors.” https://sensirion.com/products/applications/mobility/hydrogen-for-fuel-cells