Enhanced Raman (CERS, fiber, SERS & coherent Raman)
Summary
Section titled “Summary”Hydrogen is nearly invisible to spectroscopy by every method except one. Because H2 has no permanent electric dipole and no infrared-active vibration or rotation, all the workhorse gas sensors that other molecules respond to — TDLAS, NDIR, FTIR — cannot see it. Raman scattering, which depends on how a molecule’s polarizability changes as it vibrates rather than on a dipole moment, is one of the only optical windows onto H2 at all, alongside mass spectrometry and gas chromatography.
Raman scattering is intrinsically extremely weak — roughly a trillion times weaker than absorption-based methods — so a whole family of “enhanced Raman” techniques exists to recover signal:
- bounce the laser through the gas dozens of times (multipass cells),
- trap it in a resonant optical cavity so it circulates thousands of times (cavity-enhanced Raman, CERS),
- guide it collinearly with the gas down a hair-thin hollow fiber for meters at a time (fiber-enhanced Raman, FERS),
- concentrate the electromagnetic field at a metal nanostructure (surface-enhanced Raman, SERS),
- or trade linear scattering for a nonlinear four-wave-mixing process entirely (coherent Raman: CARS, SRS, PARS).
For Hestia: several of these routes reach genuinely useful sub-ppm to low-ppm H2 sensitivity on an optical bench, and Raman’s “fingerprint” selectivity lets it resolve H2 alongside CH4, CO2, N2, O2, He, and H2S in one spectrum — a real advantage for source discrimination at a fixed monitoring station. But none of it is currently backpack-portable for soil-gas grid surveys, none of it is downhole-rated, and one popular marketing claim — “SERS hydrogen sensor” — is very often not what it claims to be.
At a glance — published performance envelope
- Detection limit
- 0.06–400 ppm
- Range
- 0.06–1,000,000 ppm
- Response t90
- 0.3–250 s
- Recovery
- 0.3–300 s
- Selectivity
- high
- Drift
- medium
- Operating T
- 5 … 400 °C
- Humidity
- 0–100 % RH
- Power
- 10 mW – 240 W
- Unit cost
- $20k–$200k
- TRL
- 5
Main interferents: CH₄, CO₂, N₂, O₂ · poisons: SERS substrate film oxidation, Pd surface sulfur poisoning H2S, fiber bore particulate soil biofouling. Ranges span the published devices/variants covered below — per-claim citations are in the body; data: src/data/modalities/enhanced-raman.yaml.
Mechanism & physics
Section titled “Mechanism & physics”Why gas-phase Raman is hard in the first place
Section titled “Why gas-phase Raman is hard in the first place”Spontaneous Raman scattering intensity from a gas sample scales as
where is incident laser irradiance, is the number density of the scattering molecule (so by the ideal gas law — a fact that matters a great deal for hot downhole gas), is the differential Raman scattering cross-section, the collection solid angle, the interaction (path) length, and the overall collection/detection efficiency.
For spontaneous Raman, is minuscule — roughly – for small molecules. For N2 at 488 nm the absolute backscattering differential cross-section is [1]; H2 has a relative cross-section of about 2.2× that of N2 at 514.5 nm [1][2] — still 12–14 orders of magnitude smaller than a typical strong electronic-absorption cross-section.
Every “enhanced Raman” technique below recovers those orders of magnitude through (more photons on the molecule), (more path length or dwell time), or a local field-enhancement multiplier on itself (SERS/plasmonics, coherent processes).
H2’s Raman spectrum is unusually favorable for gas ID despite the weak cross-section: as a homonuclear diatomic it has no permanent dipole moment and no IR-active vibration or rotation, so Raman (and mass spec/GC) are essentially the only spectroscopic routes to it directly.
Q-branch position. The H2 vibrational Q-branch sits near 4155–4161 cm⁻¹, a 2.41–2.40 µm vibrational quantum that scatters at ≈683 nm for a 532 nm pump (ortho/para components at ~4155 cm⁻¹ [Q1(1)] and ~4161 cm⁻¹ [Q1(0)], with additional lines at ~4143 and ~4126 cm⁻¹ from higher-J states) [3][4], far removed from the crowded fingerprint region (CH4 ν1 ≈ 2917 cm⁻¹, CO2 ≈ 1285/1388 cm⁻¹, N2 ≈ 2331 cm⁻¹ — all scattering between ≈571 and 630 nm at 532 nm), so cross-talk on the vibrational line is minimal.
H2 also has a strong pure-rotational ladder — S(0) ≈ 354–357 cm⁻¹, S(1) ≈ 587–592 cm⁻¹ (scattered ≈542–549 nm at 532 nm) [4][5] — which fiber SRS and collision-enhanced FERS exploit because it sits closer to the pump and can scatter more efficiently in stimulated regimes.
Multipass path-length extension (Herriott/White)
Section titled “Multipass path-length extension (Herriott/White)”The simplest enhancement is purely geometric: fold the beam through the sample times with spherical mirrors (Herriott or White cell configurations) so . A Herriott-type cell can achieve on the order of 33 passes and a White-type cell up to ~46 passes in compact commercial units [6]; folded/Z-shaped dense-pattern designs used in Raman gas probes bounce the beam between 2–4 spherical mirrors for effective path lengths well beyond a single traversal [7][8]. Gain is linear in the number of passes (not exponential), fundamentally limited by mirror clipping losses and astigmatism once reaches the hundreds.
Cavity buildup (CERS / PECRS)
Section titled “Cavity buildup (CERS / PECRS)”Cavity-enhanced Raman spectroscopy (CERS, sometimes “PECRS” for power-enhanced/optical-feedback CERS) locks a laser into a high-finesse linear optical cavity so that circulating intracavity power greatly exceeds the input power :
where is the cavity finesse and the (matched) mirror power reflectivity. With , finesse of several thousand is achievable [9][10]; demonstrated systems report finesse exceeding 2500 with ~240 mW input producing ~1 kW circulating power via Pound-Drever-Hall (PDH) locking [11][12], while Hippler-group instruments couple low-cost diode lasers via optical feedback (rather than PDH) into a two-mirror () cavity for ~three orders of magnitude circulating-power enhancement from an inexpensive ~40 mW diode [9][13].
Because both the pump enhancement (linear in ) and the effective path length contribute, CERS is best thought of as a multipass cell where the “number of passes” is set dynamically by the finesse rather than mirror geometry alone.
Fiber-enhanced Raman (FERS) and mode confinement
Section titled “Fiber-enhanced Raman (FERS) and mode confinement”FERS replaces free-space multipass optics with a hollow-core fiber (HCF) that guides pump and Raman-scattered light collinearly through the gas over meter-scale lengths in a fiber-jacket-diameter package. The key figure of merit is the mode-overlap integral between the pump mode and the gas-filled core — well-matched hollow-core photonic-crystal fiber (HC-PCF) or anti-resonant fiber (ARF) can reach overlap factors near unity (one demonstration reported ~85% coupling efficiency with mode field diameter at 75% of core diameter) [14]. Enhancement over free-space 90°-collection Raman of ~700× has been reported for hollow-core photonic-bandgap fiber (HC-PBGF) [15], and backward (epi-) collection through the same fiber gives near-360° effective collection solid angle versus a small-NA free-space lens [14].
Gas must diffuse into the fiber core through open access points or end-cells before a stable signal is obtained; that equilibration is diffusion-limited and is FERS’s chief practical drawback for field response time (see Performance envelope, below).
Metal-lined hollow capillaries
Section titled “Metal-lined hollow capillaries”An older, mechanically simpler alternative to HC-PCF is a plain fused-silica or glass capillary with a reflective metal coating (Ag, Au, or Pt) on the bore, guiding light by grazing-incidence metallic reflection rather than a photonic bandgap or anti-resonance effect — broader (achromatic) guiding bandwidth than HC-PCF, at the cost of higher propagation loss. Reported signal gains over conventional 90° free-space Raman are around two orders of magnitude, with roughly a further order-of-magnitude improvement in detection limit reported from fluorescence-suppression signal processing [16]; an ALD platinum-coated capillary reached low-ppm detection limits for light alkanes (CH4, C2H4, C2H6) within tens of seconds [17].
Collision-enhanced Raman scattering (a distinct effect confusingly sharing the CERS acronym)
Section titled “Collision-enhanced Raman scattering (a distinct effect confusingly sharing the CERS acronym)”A separate effect, unfortunately abbreviated identically: mixing the analyte with a Raman-inactive buffer gas (He or N2) inside an HC-PCF can enhance the stimulated Raman signal of H2 by up to five orders of magnitude for He buffering and up to three orders of magnitude for N2 buffering at an 80:20 buffer:H2 ratio, via collisional narrowing of the Raman linewidth that concentrates gain into a narrower spectral feature and raises peak Raman gain [18].
This works because the SRS gain coefficient depends on (population difference over linewidth), and collisional (Dicke) narrowing shrinks without touching (unverified) [19].
SERS / plasmonic enhancement — and why H2 mostly defeats it
Section titled “SERS / plasmonic enhancement — and why H2 mostly defeats it”Surface-enhanced Raman scattering multiplies itself via the local electromagnetic field enhancement at a plasmonic “hot spot” (roughened or nanostructured Au/Ag), scaling approximately as for the combined excitation+emission enhancement. Reported enhancement factors for well-behaved chemisorbing analytes on engineered substrates commonly reach – [20][21].
SERS requires the analyte molecule to sit within a few nanometers of the metal surface, ideally in the hot spot itself, and meaningful chemisorption or at least strong physisorption is what gets it there and holds it long enough to scatter. H2 has essentially no permanent or easily induced dipole, negligible polarizability change on physisorption, and very weak binding energy (<100 meV) on coinage metals (Au, Ag) [22].
A study built explicitly to test SERS of physisorbed H2/D2 needed a cryogenic (10 K) picocavity — a sub-nanometer plasmonic gap between an atomically sharp Ag STM tip and an Ag(111) surface — to see single-molecule Raman signal at all, and the authors attribute the need for cryogenic operation to H2’s intrinsically weak adsorption and its lack of the chemical (charge-transfer) enhancement mechanism that boosts SERS for chemisorbed organics [22].
Coherent Raman: CARS and SRS
Section titled “Coherent Raman: CARS and SRS”Coherent anti-Stokes Raman scattering (CARS) uses two beams (pump , Stokes ) tuned so matches a Raman resonance, generating a new coherent beam at . Because it is a four-wave-mixing process, the resonant CARS signal intensity scales as
i.e., quadratically in number density — a significant drawback for trace detection, since a 10× drop in concentration costs 100× in signal — compounded by an always-present nonresonant electronic background that interferes with (and at low concentration, swamps) the resonant term [23][24].
Polarization-based or time-delayed (fs/ps hybrid) background-suppression schemes partially recover sensitivity: hybrid fs/ps CARS gas-phase detection limits for H2 have been reported at number densities of order , roughly percent-level, not ppm [25][26].
SRS (gain/loss on one of the two beams rather than a new coherent beam) is background-free of the nonresonant term in principle and scales linearly, not quadratically, in , which is why cavity-enhanced stimulated Raman schemes, rather than CARS, have actually been pushed toward ppm-level H2 detection [27].
Photoacoustic Raman spectroscopy (PARS)
Section titled “Photoacoustic Raman spectroscopy (PARS)”PARS is stimulated-Raman gain detected acoustically: two temporally/spatially overlapped beams (pump + Stokes) at the Raman-resonance detuning create a stimulated Raman gain/loss process; because SRS is intrinsically background-free, the resulting periodic heating of the resonant molecules is detected as a pressure wave with a microphone, sidestepping the shot-noise floor of photon-counting spectrometers entirely.
Reported detection limits:
- Historical noise-equivalent detection limits for H2 by pulsed-laser PARS were 40 ppm (1979-era Nd:YAG-pumped Raman shifter) and 4.6 ppm (dye-laser-pumped) [28]
- modern bichromatic high-power PARS reaches an estimated LOD of 3.4 ppm H2 at 0.3 MPa with 10 ppm demonstrated directly [29]
- the most recent cavity-enhanced continuous-wave intracavity pump-Stokes PARS reports 0.5 ppm minimum detectable H2 with ~200 s averaging [30].
Variants & subtypes
Section titled “Variants & subtypes”A working taxonomy, in roughly increasing order of engineering sophistication:
- Multipass free-space cells (Herriott, White, dense Z-pattern, “bidirectional” designs) — passive, alignment-sensitive, path length set by mirror geometry and beam-clipping limits [6][7][8].
- Cavity-enhanced Raman spectroscopy (CERS / PECRS) — active resonant buildup requiring laser-cavity locking:
- PDH-locked, narrow-linewidth lasers into ultra-high-finesse cavities (finesse >2500, kW-class circulating power from ~100s of mW input) [11][12][31].
- Optical-feedback-locked low-cost diode lasers into moderate-finesse cavities (power buildup ~10³×, using $10–100 diode lasers rather than stabilized lab lasers) — the Hippler-group approach, aimed explicitly at low-cost field-deployable instruments [9][13].
- Line-narrowed blue/UV diode plus external power build-up cavity, extending CERS toward shorter wavelengths for higher cross-section and less fluorescence interference [32].
- Fiber-enhanced Raman spectroscopy (FERS):
- Hollow-core photonic-bandgap fiber (HC-PBGF) — narrowband, high extinction of cladding modes, historically the first HC-PCF gas-Raman demonstrations (NKT Photonics HC-800/HC-1550 series) [15][33].
- Anti-resonant hollow-core fiber (AR-HCF / negative-curvature fiber) — simple single-ring or nested-tube cladding, broadband (400–1200+ nm) transmission, lower Fresnel/backscatter background, currently the most active R&D fiber class for trace-gas FERS [14][34][35].
- Kagome-lattice hollow-core fiber — a related broadband anti-resonant-guidance geometry, widely used for gas-laser and nonlinear-optics work in H2-filled fiber (SRS fiber lasers), though less commonly named explicitly in the trace-sensing FERS literature [36].
- Collision-enhanced FERS — buffer-gas (He/N2) loaded HC-PCF for SRS linewidth narrowing, up to 10⁵× signal gain for H2 [18][19].
- Metal-lined hollow capillaries — Ag/Au/Pt-coated glass capillary waveguides, broadband achromatic guiding, mechanically robust, historically predates HC-PCF FERS [16][17][37].
- SERS / plasmonic-enhanced Raman:
- Ensemble nanoparticle SERS substrates (Au/Ag colloids, nanopillars, nanopores) — proven for polar/chemisorbing vapors (VOCs, chemical-warfare-agent simulants, H2S via derivatization) [38][39], essentially unproven for direct bulk-gas H2 detection.
- Bimetallic/Pd-decorated plasmonic structures — used for hydrogen sensing, but overwhelmingly via localized surface plasmon resonance (LSPR) wavelength-shift upon Pd→PdHx phase transition, which is a refractive-index/absorption sensing mechanism, not an enhanced-Raman-scattering mechanism, even though it is sometimes grouped with “plasmonic H2 sensors” in secondary literature — see Plasmonic metamaterials for the real LSPR story [40][41][42].
- Cryogenic single-molecule picocavity TERS/SERS of physisorbed H2/D2 — the only located literature demonstrating actual enhanced Raman scattering of the H2 molecule itself via a plasmonic mechanism; requires 10 K and STM tip positioning [22].
- Coherent Raman: CARS (broadband/multiplex, polarization-suppressed, hybrid fs/ps) [23][25]; stimulated Raman scattering / stimulated Raman gain or loss spectroscopy (SRS/SRGS/SRLS), including all-fiber CW-pumped SRGS in HC-PCF [43][44].
- Photoacoustic Raman spectroscopy (PARS) — pulsed dye/Nd:YAG-pumped historical demonstrations through modern bichromatic and cavity-enhanced CW variants [28][29][30].
Performance envelope
Section titled “Performance envelope”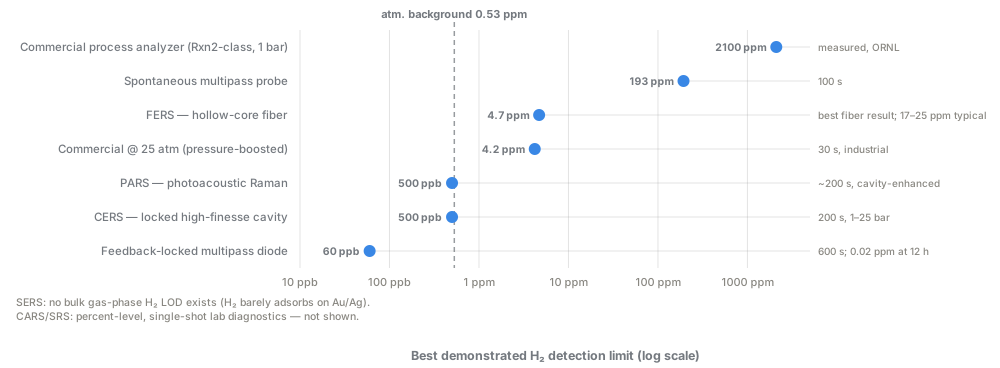
The enhancement ladder: each rung is the best H₂ result located in the literature for that technique (integration times differ — see table below).
| Technique (specific study) | Reported H2 LOD | Integration/averaging time | Pressure | Notes | Ref |
|---|---|---|---|---|---|
| Multipass free-space Raman probe (concentric 4-mirror) | 192.9 ppm (3σ) | 10 s × 10 accumulations (100 s) | ~1 bar | Also CH4 44.5 ppm, CO2 317.5 ppm; ~4.6× SBR gain vs. commercial probe | [7] |
| CERS, optical-feedback diode (Hippler-style, natural-gas) | ~ppm-level (H2S 100 ppm @ 1 bar; extrapolated 10 ppm @ 100 bar) | not uniform | 1–100 bar | ~1000× circulating power buildup from ~40 mW diode | [9][13] |
| CERS, PDH-locked high-finesse (multi-gas, sub-ppm) | sub-ppm (various species) | up to ~2500 s (equiv.) | up to 2.5 MPa | Finesse >2500, ~1 kW circulating power from 240 mW input | [11][12] |
| CERS for H2 fuel-cell trace impurities | 0.5 ppm H2 | 200 s | 0.1–2.5 MPa | 4-mirror multipass + locked cavity; sub-ppm/ppb for O2, N2, CO, CO2, CH4, NH3, H2S | [10] |
| Multipass cavity, feedback-narrowed blue diode (Singh & Muller 2023) | 0.075 ppm detected / 0.06 ppm LOD | 600 s | 0.2 MPa | Also 60 ppb (10 min)–20 ppb (12 h); measured ambient air H2 = 0.533 ± 0.02 ppm | [45] |
| FERS, HC-PCF all-fiber SRGS (1550 nm) | 17 ppm | 250 s | fiber-length dependent | All-fiber CW stimulated Raman gain spectroscopy | [43] |
| FERS, 7 m HC-PCF, highly sensitive all-fiber sensor | 24.8 ppm | not stated | not stated | See also [45] Table 1 (“FERS” 4.7 ppm) | [43][45] |
| FERS, AR-HCF (H2 + SO2), backward collection | low-ppm (H2, SO2, CO2, O2, N2 multi-gas) | 60 s | 5 bar | 26 µm core, 0.5 m length, ~85% coupling; instability <1.05% | [14][34] |
| Collision-enhanced FERS (He/N2 buffered HC-PCF, SRS) | up to 10⁵× (He) / 10³× (N2) signal enhancement over unbuffered FERS | ns-pulsed, 7 Hz | not stated | NKT HC-800-B fiber, 2 m, 7.5 µm core | [18] |
| Metal-coated (Pt, ALD) capillary Raman probe | 21 ppm CH4, 30 ppm C2H4, 51 ppm C2H6 (H2 not headline gas) | 45 s | not stated | 25 s response time | [17] |
| PARS, pulsed Nd:YAG/dye laser (historical) | 40 ppm / 4.6 ppm (two studies) | not stated | 1 atm (in N2) | Earliest PARS H2 demonstrations (1980s) | [28] |
| PARS, bichromatic high-power | 3.4 ppm (LOD), 10 ppm demonstrated | ~10 s | 0.3 MPa | [29] | |
| PARS, CW cavity-enhanced intracavity pump-Stokes | 0.5 ppm | ~200 s | not stated | Most sensitive PARS located in this review | [30] |
| CARS, hybrid fs/ps | ~10¹⁵ molecules/cm³ (≈ percent-level at 1 atm, 300 K) | single-shot | 1 atm | Quadratic scaling limits trace utility | [25][26] |
| SERS, picocavity, physisorbed H2/D2 | single-molecule (not a bulk-gas LOD) | n/a | UHV, 10 K | Proof-of-physics only | [22] |
| SERS, gas/vapor-phase generally (non-H2, best cases) | ~sub-ppm for HCN/Tabun on cooled substrates; ~100 ppm typical | seconds–minutes | ambient, cooled substrate | Film oxidation limits substrate lifetime | [38] |
| Commercial multi-gas Raman analyzer (532 nm, industrial natural-gas) | 4.2 ppm H2 (calc.), 9.2 ppm CO2, 9.8 ppm N2 | 30 s/sample | 25 atm | 1.5 W 532 nm laser, Hamamatsu CCD | [46] |
| IS-Instruments Aura (HC-MOF, natural-gas H2 blending) | 0.04% (400 ppm) component sensitivity | not stated | 0.5–2.0 barg tested | Also detects HD, D2; targeted at blending, not trace exploration | [47] |
| Spectral Sciences Raman H2 sensor (historical SBIR) | 0.0013 atm (≈1300 ppm) | 0.3 s response | 1 atm | 18 mW; built for jet-engine duct monitoring (speed over sensitivity) | [48] |
Selectivity: Raman is inherently a fingerprint technique — every vibrational/rotational Raman-active species produces a spectrally distinct peak, so cross-species selectivity is close to absolute for well-resolved lines, limited mainly by (a) spectral overlap of broadened lines at high pressure/high analyte loading, and (b) fluorescence background from trace hydrocarbons or particulates.
T/P range: wide for the underlying physics — Raman works cryogenic-to-hundreds-of-°C and vacuum-to-hundreds-of-bar, and higher pressure helps number-density-limited signal — but T/P range for the hardware (cavity mirrors, fiber coatings/splices, locking electronics) is set by enclosure/optics engineering, not the physics, and every demonstrated system reviewed here ran at room temperature and ≤2.5 MPa.
Drift: CERS/cavity-locked systems need active thermal/mechanical stabilization (one E. coli-monitoring CERS system held cavity temperature to 24 ± 1 °C over 24 h) [49]; FERS drift is dominated by fiber-coupling stability (<1.05% long-term instability reported for one AR-HCF system) [34].
Response time: FERS/capillary systems are set by gas diffusion into/out of the confined bore — 25–60 s typical for meter-scale fibers/capillaries near atmospheric pressure [14][17] — versus sub-second response for free-space multipass/CERS systems, limited only by spectrometer integration time [7][48].
Figures of merit
Section titled “Figures of merit”The universal figures of merit — sensitivity, LOD, selectivity, drift, and the rest — are defined in full on the Figures of merit page; the table below specializes them to enhanced Raman’s specific physics and adds the enhancement-factor metrics (multipass count, cavity finesse, fiber mode-overlap) that decide whether a given variant reaches useful H2 sensitivity at all. Concentrations are ppm/ppb by volume unless noted — see Concentration units for conversions.
Figures-of-merit table for this modality (14 rows)
| Figure of merit | Symbol / formula | What it means here | Typical value for this technology | How to read it |
|---|---|---|---|---|
| Sensitivity (photon-budget) | Raman signal is photon-limited, not slope-limited — SNR grows with the square root of optical power times integration time rather than a fixed ppm-to-signal calibration constant | Laser sources across the reviewed literature span ~18 mW (duct-monitoring free-space Raman) to ~1.5 W (commercial 532 nm multi-gas analyzer) [48][46] | Every technique below buys sensitivity by trading power or time (or both) against this square-root law; there is no setting that adds sensitivity for free | |
| Best demonstrated H2 LOD | Smallest H2 concentration resolved above background in the best located academic instrument | 0.06 ppm at 600 s integration (feedback-narrowed blue-diode multipass cavity); 20 ppb with 12 h averaging, same instrument [45] | Report the LOD together with its integration time; a bare “20 ppb” implies a 12-hour dwell, not a field-usable reading | |
| LOD vs. integration time | (until drift dominates) | How much longer averaging actually buys you before drift, not noise, sets the floor | Same instrument: 0.075 ppm detected / 0.06 ppm LOD at 600 s → 60 ppb at 10 min → 20 ppb at 12 h [45] | The LOD ladder in the Performance envelope table above is a curve, not one number per technique, and most vendor literature reports only its best (longest-averaging) point |
| Enhancement factor — multipass count | Number of beam traversals through the gas cell from spherical-mirror folding | Herriott-type cells ~33 passes, White-type ~46 passes in compact commercial units [6]; Z-shaped 4-mirror dense multipass folds the path further still via 2–4 bounce mirrors [7][8] | Gain is linear in , not exponential, and mirror clipping/astigmatism caps practical in the low hundreds | |
| Enhancement factor — cavity finesse / power buildup | , | Finesse sets a dynamic, mirror-geometry-independent “effective pass count” via resonant power circulation | Finesse >2500 with ~240 mW input → ~1 kW circulating (~4000×) via PDH locking [11][12]; ~1000× buildup from a ~40 mW diode via optical-feedback locking [9][13] | The largest single enhancement factor in this modality, but it requires an actively locked cavity, which is the direct cause of CERS’s thermal-stabilization burden (see Drift/stability row) |
| Enhancement factor — fiber mode-overlap | Overlap integral, pump mode ↔ gas-filled core | How completely the guided light interacts with the gas rather than the cladding | ~85% coupling efficiency reported for one HC-PCF, mode-field diameter at 75% of core diameter [14]; translates to ~700× signal enhancement over free-space 90° collection for HC-PBGF [15] | Near-unity overlap plus near-360° backward (epi-) collection is what lets a fiber the width of its jacket rival a bulk optical bench |
| Effective path length | Physical/optical interaction length the gas actually sees | FERS gas-filled lengths span ~0.5 m (anti-resonant HCF) [14][34] to ~2 m (collision-enhanced HC-PCF) [18] to ~7 m (HC-PCF sensor) [43][45]; CERS’s effective path length is not stated in meters in the literature — it is set dynamically by finesse rather than physical length (unverified as a meters figure) | Compare path-length numbers only within the same enhancement family; a “7 m fiber” and a “1 kW circulating cavity” are two different currencies for the same term in the underlying Raman-intensity equation | |
| SNR gain over spontaneous (90°) Raman | Ratio vs. free-space 90°-collection baseline | How much signal-to-background a given enhancement buys over the textbook bulk-gas Raman geometry | ~4.6× signal-to-background gain, multipass probe vs. commercial backscatter probe [7]; ~100× for a metal-coated capillary vs. 90° free-space, plus a further ~10× from fluorescence-suppression processing [16]; ~700× for HC-PBGF FERS vs. free-space 90° collection [15] | These numbers use different baselines and collection geometries and are not directly comparable to each other; each is only a valid before/after claim within its own paper |
| Selectivity / cross-sensitivity | Raman’s fingerprint spectral separation of H2 from co-evolved CH4, CO2, N2, O2, H2S, He | Near-absolute for well-resolved lines; the documented failure mode is line-broadening cross-talk, not spectral overlap — neglecting heavy alkanes overestimated ethane by ~35%, propane by ~77%, butanes by 200–300%, and biased O2 by up to 200 ppm in one natural-gas study [46] | Selectivity is a genuine strength of this modality, but “selective” here means species-resolved, not immune to matrix-dependent line-shape bias during quantification | |
| Response / recovery time | How fast the reading catches up to a real concentration step | Sub-second, spectrometer-integration-limited for free-space multipass/CERS [7][48]; 25–60 s, diffusion-limited for FERS/capillary designs [14][17] | The free-space/cavity family is fast; the fiber family trades response time for its compact, potentially remote-deployable architecture, governed by gas diffusing into the fiber bore | |
| Dynamic range | Full span of usable H2 readout for a single instrument | Not systematically characterized per-instrument in the reviewed literature; the spread of best-demonstrated LODs across all techniques runs from ~20 ppb to percent-level [25][26][45] (unverified as a single-instrument figure) | Do not infer a wide dynamic range for any one device from the spread across the whole technique family — that spread is different instruments, not one calibrated range | |
| Drift / stability | Baseline/alignment creep, dominated here by cavity-lock or fiber-coupling stability rather than chemical drift | CERS cavity held to 24 ± 1 °C over 24 h in one system [49]; FERS long-term instability <1.05% reported for one AR-HCF system [34] | CERS systems fail “soft” (lose lock, signal drops to near zero, easily flagged) rather than drifting silently wrong, a genuine field-robustness advantage once the stabilization overhead is accepted | |
| Power | Laser/source input power | Optical source power draw, excluding supporting electronics | Sources span ~18 mW to ~1.5 W across the reviewed instruments [48][46][9][13][11][12] | The laser itself is often low-power; it is the supporting spectrometer, cooled CCD, and cavity-lock electronics — not tabulated as a system wattage figure anywhere in the reviewed sources (unverified) — that keep this modality bench/rack-scale rather than handheld |
| Operating envelope (T/P) | Where the hardware, not the physics, is validated to hold its calibration | Every demonstrated system reviewed here ran at room temperature and at or below 2.5 MPa | The T/P ceiling is a mirror/fiber-splice/locking-electronics engineering limit, not a Raman-physics one — the physics itself works cryogenic-to-hundreds-of-°C and vacuum-to-hundreds-of-bar, with higher pressure favoring signal via |
What dominates. For a geologic-H2 job, two figures decide whether enhanced Raman is usable at all: the achievable H2 LOD at an integration time you can actually afford in the field, and the enhancement factor (multipass count, cavity finesse, or fiber mode-overlap) that gets you there — because every route in this family buys its entire sensitivity advantage over spontaneous Raman by trading in optical power and/or integration time, exactly the LOD–response time–power triangle.
Selectivity advantage, offset by constraints. Selectivity is enhanced Raman’s genuine edge — near-fingerprint discrimination of H2 alongside CH4, CO2, N2, O2, H2S, and He in one spectrum — but that edge is moot if the sub-ppm LOD numbers only exist at room temperature, inside an actively-locked, thermally-stabilized cavity averaging for minutes to hours, which is precisely why this modality reads as usable at a fixed monitoring station today and not yet for a soil-gas survey or downhole log.
Environmental covariance & cross-sensitivity
Section titled “Environmental covariance & cross-sensitivity”Because Raman spectra resolve each gas species by a distinct spectral shift rather than a single broadband signal, most cross-sensitivity issues in Raman gas analysis are optical/spectral rather than chemical — fundamentally different from electrochemical or catalytic-bead H2 sensors (see Electrochemical cells and Catalytic pellistors for contrast):
- Water vapor / humidity: water’s broad OH-stretch Raman band (~3200–3600 cm⁻¹; scattered ≈641–658 nm for a 532 nm pump) does not overlap the H2 Q-branch (~4155–4161 cm⁻¹; ≈683 nm) or the S(0)/S(1) rotational lines (~354–592 cm⁻¹; ≈542–549 nm), so humidity is not a direct spectral interferent for H2 lines; however, condensation on optics/fiber facets, and water’s effect on line-broadening/collisional environment inside a cavity or fiber, are practical nuisances. One multipass Raman gas probe reported water-vapor sensitivity quantified at ~0.67% RH-equivalent noise floor in a multigas measurement [7].
- Temperature: enters twice — (1) through number density , meaning a hot downhole gas sample at fixed pressure has intrinsically lower Raman signal than the same gas cooled to STP, a real quantitative penalty for high-T downhole logging; and (2) through cavity/fiber alignment drift in CERS systems, which is why demonstrated CERS instruments actively thermally stabilize the cavity (±1 °C over 24 h in one case) [49].
- Pressure: generally favorable for Raman signal (higher ), but at high pressure, Raman lines broaden and shift — documented explicitly for the H2 vibrational Q-branch and for CH4’s ν1 line, whose peak position and width are used as an internal pressure gauge in fluid-inclusion Raman geobarometry [50][51]. This pressure-dependent broadening/shift must be corrected for in quantitative deconvolution of multi-gas mixtures at reservoir pressures.
- O2, N2, CO, CO2, CH4, H2S, He (co-evolved gases): all Raman-active (homonuclear O2/N2 included) and spectrally distinguishable from H2’s Q-branch and rotational ladder in the vast majority of cases; demonstrated CERS/FERS multi-gas panels routinely report simultaneous, mutually-resolved detection of H2, N2, O2, CO2, CH4, CO, NH3, H2S in a single spectrum [10][14][46]. The dominant quantitative (not qualitative) cross-sensitivity documented is line broadening of a minor species by a co-present major species changing local pressure/collision environment — e.g., a natural-gas Raman analyzer study found that neglecting heavier alkane (C5+) contributions caused ethane to be overestimated by ~35%, propane by ~77%, and butanes by 200–300%, and that O2 quantification error could reach 200 ppm from methane ν2-band broadening effects under variable heavy-alkane loading [46]. Helium, being Raman-silent in the vibrational fingerprint region relevant here (monatomic; only Rayleigh, no Raman-active internal modes), is not a spectral interferent for H2’s ro-vibrational lines, but is exploited deliberately as a buffer gas to enhance H2 signal in collision-enhanced FERS [18].
- Poisoning / substrate degradation (SERS only): SERS substrates for gas/vapor sensing are reported to degrade via film oxidation, which limits substrate lifetime and reusability and caps practical sensitivity around the 100 ppm level for general vapor-phase SERS even where the target analyte adsorbs reasonably well [38]; for the Pd-decorated hydrogen-plasmonic sensors that are sometimes conflated with “SERS for H2,” sulfur-containing gas-stream contaminants (directly relevant to H2S-co-evolved natural H2 exploration settings) are documented to poison Pd active sites and block hydrogen dissociation/adsorption [52].
- CARS-specific cross-sensitivity: the nonresonant background is itself a function of the total gas composition (all species contribute to the nonresonant electronic susceptibility), so a change in bulk gas matrix (e.g., soil gas with variable CO2/N2/O2 fractions) shifts the interfering baseline against which a weak resonant H2 signal must be extracted — a background problem that has no clean analog in spontaneous Raman or CERS/FERS [23][24].
- Failure modes summary: cavity-locked CERS systems fail “soft” (lose lock, signal drops to near-zero, easily flagged) rather than “silent-wrong” (a real field-worthiness advantage versus, e.g., a poisoned electrochemical cell that reads low without an obvious fault flag); FERS/capillary systems fail via fiber-facet contamination or bore clogging (particulates, condensation, biofouling in soil-gas probes) that manifest as elevated background and slow response rather than catastrophic sensor loss.
Use for geologic H2
Section titled “Use for geologic H2”Soil-gas surveys
Section titled “Soil-gas surveys”Free-space multipass and CERS instruments are bench/rack-scale (spectrometer, cavity optics, thermal stabilization) and are not hand-carried grid-survey tools today; nothing in the literature describes a backpack- or handheld-format CERS/FERS H2 unit.
Standoff systems. The most field-relevant surface application found is a standoff system rather than a point sensor: Xcalibur Smart Mapping’s H-MAS (Hydrogen Mapping Airborne Spectrometer), an airborne standoff Raman/Raman-LiDAR system developed with Curtin University that Raman-probes near-surface air remotely from an aircraft, flown alongside FALCON gravity-gradiometry/magnetics for combined surface-anomaly and subsurface-structure mapping [53][54][55]; Xcalibur has also reported a lab-scale 3D hydrogen-plume mapping demonstration with a “Quantum Raman Spectrometer” prototype [56] and an airship-based trial with Cloudline for near-surface fugitive-gas (CH4/NH3/H2) mapping [57].
Field LOD gap. None of these disclosures include a peer-reviewed, sourced ppm-level LOD for the deployed system — a real, well-resourced program worth tracking, but no citable quantitative field LOD could be located. See Geologic context for how a validated standoff-Raman survey would fit alongside gravity/magnetics workflows.
Downhole/borehole logging
Section titled “Downhole/borehole logging”This is where enhanced-Raman looks structurally worst-suited among the mainstream H2 sensing modalities. Three compounding reasons:
- CERS electronics/optics constraint: every demonstrated CERS system requires actively-locked, thermally-stabilized cavity optics with sub-µm mechanical tolerances — the opposite of “no downhole electronics/optics” — and none is reported to operate above room temperature.
- FERS/capillary temperature/pressure ceiling: FERS/capillary approaches are more promising in principle (a passive fiber carrying light to/from a remote gas-filled section is architecturally compatible with “electronics at the surface, only fiber goes downhole,” the philosophy already used for distributed-temperature-sensing (DTS) fiber in wells [58]; see Fiber-optic sensors), but no publication demonstrates an HC-PCF or capillary FERS probe rated for the temperatures (100s of °C) and pressures of deep hydrogen-bearing horizons — the one directly relevant high-T/P Raman paper (H2 characterized up to 400 °C and 40 MPa) is a fluid-inclusion geochemistry calibration study, not a logging-tool demonstration, though it does establish the H2 signature stays usable at reservoir-relevant T/P [50].
- H2-induced fiber darkening: standard telecom-grade fiber itself suffers H2-induced loss from interstitial H2 diffusing into the glass and forming absorption/scattering centers at high downhole H2 partial pressure and temperature — well documented for DTS/DAS fiber in H2-rich wells, usually but not always reversible on removal [59] — a foundational materials problem for any fiber-coupled Raman approach, since natural-hydrogen wells are by definition H2-rich.
In summary, this is not currently a fielded or even convincingly prototyped downhole technology; it is worth a watching brief, not an assumption of readiness.
Continuous monitoring stations
Section titled “Continuous monitoring stations”This is the best-matched of the three use cases. A rack- or enclosure-mounted CERS or bench FERS instrument at a fixed station has no strong size/weight/power constraint, tolerates CERS’s thermal-stabilization needs, and gains real value from Raman’s multi-species panel for source discrimination (biogenic vs. abiotic vs. atmospheric mixing) that a single-species electrochemical or catalytic sensor cannot provide.
Commercial process analyzers already exist in this form factor for natural-gas composition monitoring (Endress+Hauser/Kaiser Raman Rxn-series, IS-Instruments Aura) [47][60][61], though their as-shipped H2 sensitivity (hundreds of ppm to sub-percent, tuned for pipeline blending rather than trace exploration-anomaly levels of ~1 ppm–percent) sits at the coarse end of the exploration-relevant range and would need re-tuning (longer integration, cavity enhancement bolted on) to reach the academic ppm-and-below floor.
Show-stoppers
Section titled “Show-stoppers”- No commercial off-the-shelf enhanced-Raman instrument targets the ~0.5–10 ppm H2 range relevant to background-to-early-anomaly discrimination; the sub-ppm demonstrations are academic instruments, not products.
- Cost and complexity (locked cavities, cooled CCDs, ns-pulsed lasers for some FERS variants) place CERS/FERS well above catalytic-bead, electrochemical, or even TDLAS instrument classes in dollars and expertise-to-operate, for a sensitivity gain that is often comparable to or only modestly better than a good TDLAS-adjacent IR proxy method at 1 atm (see IR absorption & proxies for why H2 itself is invisible there and what proxy species are used instead).
- SERS is not currently a viable H2 gas sensor at any TRL above bench physics demonstration. For any vendor SERS “hydrogen sensing” collateral, check explicitly whether the claimed mechanism is Raman scattering enhancement (rare, unproven for bulk-gas H2) or Pd LSPR wavelength-shift sensing (real, but not Raman — see Plasmonic metamaterials).
- CARS is not field-relevant for trace H2 given quadratic concentration scaling and the persistent nonresonant background; the literature explicitly treats CARS as a combustion/high-temperature-flow diagnostic, not a trace-gas sensor [23][25].
- Every quantitative LOD in this page comes from a controlled lab bench, standard gas mixtures, and (mostly) short-duration demonstrations; none include a multi-week field drift/robustness dataset in real soil-gas or ambient-air conditions with the full covariate stack (humidity swings, temperature cycling, particulates, co-evolved H2S) — treat all LODs as best-case, lab-floor numbers.
Vendors & products
Section titled “Vendors & products”| Vendor | Product / line | Technology | Key claimed specs | Price class | Source |
|---|---|---|---|---|---|
| IS-Instruments Ltd (Tonbridge, UK) | Aura | HC-MOF (hollow-core microstructured optical fibre) Raman, patented | ~0.04% (400 ppm) component sensitivity; tested 0.5–2.0 barg; detects H2, D2, HD; targeted at pipeline H2-blending, not trace exploration | Not publicly listed; industrial process-analyzer class | [47][61] |
| Endress+Hauser (Kaiser Optical Systems) | Raman Rxn5, Rxn4, Rxn2 | Conventional dispersive Raman (not cavity/fiber-enhanced), fiber-delivered probes to 500 ft | 15–30 s sampling (vs. 4–6 min GC); to ~70 bar / ~150 °C at probe; derives Wobbe Index/heating value | Industrial (tens of $k–$100k+ per turnkey system; unverified) | [60][62][63] |
| GLOphotonics SAS (Limoges, France) | PowerLink (Photonic MicroCell on Inhibited-Coupling HC-PCF) | Hermetically-sealed gas-fillable HC-PCF module; broadband UV–IR; <10 dB/km loss | Enabling fiber component for FERS/gas-cell research, not a complete analyzer | Component/OEM class; no public pricing | [64][65] |
| NKT Photonics A/S | HC-800(-B), HC-1550(-02) hollow-core photonic-crystal fiber | HC-PCF (photonic-bandgap), low-loss windows (e.g. 1500–1650 nm) | Analyte-guiding fiber in multiple FERS/collision-enhanced-Raman demonstrations | Component/OEM class; no public pricing | [18][33] |
| Xcalibur Smart Mapping | H-MAS, integrated with FALCON AGG | Airborne standoff Raman (“Raman LiDAR”) of near-surface atmosphere | No independently-verified LOD publicly located; exploration survey tool, not a point sensor | Airborne-survey-service class (contracted campaigns) | [53][54][55][56][57] |
| Tornado Spectral Systems (Toronto) | Raman analyzers for oil & gas / LNG (product names unconfirmed) | Proprietary high-throughput Raman; marketed for homonuclear diatomics (H2, N2, O2) IR can’t see | Not located | Industrial process-analyzer class | [66] |
| Spectral Sciences, Inc. | Raman Hydrogen Sensor (historical SBIR/AEDC, Phase I) | Free-space laser Raman, optimized for fast response over sensitivity | 0.0013 atm (~1300 ppm) LOD, 0.3 s response, 18 mW | R&D/government program; not current product | [48] |
| Thorlabs Inc. | Herriott multipass gas cells (HC10L/M, HC30L/M) | Passive multipass free-space cell; standard building block for a DIY Raman gas probe | 10.4 m or 31.2 m path length variants; vacuum/leak tested | Component class ($1k–$5k/cell; unverified) | [67] |
A NETL (US DOE) factsheet and DOE Hydrogen Program review describe a government Raman Gas Analyzer program (fuel-gas, syngas, biogas) as R&D rather than a shipping product; the source PDF has since been re-verified as live, describing a real-time (1 s) H2 fuel-blend Raman analyzer rated to 1000 psi with >1000× optical-waveguide signal boost (US Patent 8,674,306) [68].
Open questions
Section titled “Open questions”- No independently-verified field LOD for any airborne/standoff Raman H2 exploration system. Xcalibur’s H-MAS is the most exploration-relevant enhanced-Raman program found, but every public source is company/industry-event material rather than a peer-reviewed paper with a stated ppm LOD, integration time, and standoff distance. Action: request a technical datasheet or white paper directly from Xcalibur before relying on this for any go/no-go decision.
- No downhole-rated enhanced-Raman hardware exists. No CERS, FERS, or capillary-Raman probe qualified for the temperature/pressure/vibration/H2-fiber-darkening environment of a natural-hydrogen borehole could be located. If downhole Raman logging is strategically interesting, this is a build-from-scratch R&D bet, not a buy decision — worth a scoping conversation with a fiber-sensing vendor (e.g., a DTS/DAS supplier) about H2-hardened fiber compatibility with a Raman (not just thermal-backscatter) architecture.
- Quantify the true achievable LOD at realistic field temperature for any CERS/FERS candidate before a field trial: every LOD number above is at or near room temperature; given the scaling, sizing a system for, say, a 60 °C soil-gas probe environment needs an explicit temperature-correction worked example, which the underlying research did not derive from first principles beyond flagging the scaling relationship.
- Investigate whether any group has combined collision-enhanced (buffer-gas) FERS with a locked cavity. No such hybrid was found; stacking the ~10⁵× collision-enhancement multiplier with even modest (10²–10³×) cavity buildup could, in principle, be the most sensitivity-per-dollar route to a compact ppb-class H2 Raman instrument — worth a dedicated literature-database pass.
- Verify current commercial pricing for IS-Instruments Aura and Endress+Hauser Raman Rxn-series directly with the vendors; no reviewed public source disclosed unit pricing for a gas-phase multipass/cavity-enhanced configuration specifically.
- Track the NETL/DOE Raman Gas Analyzer program — worth a direct follow-up, since a US-government-funded Raman gas analyzer program could be a useful benchmark or even a collaboration/licensing lead.
- Treat “SERS-for-H2” vendor claims with skepticism until the mechanism is verified. If any sensor vendor pitches “SERS hydrogen sensor” collateral to Hestia, the first question should be: is the claimed transduction mechanism actually enhanced Raman scattering of the H2 molecule (no legitimate ambient-condition bulk-gas demonstration exists), or is it a Pd/PdHx localized-surface-plasmon-resonance wavelength-shift sensor mislabeled as “SERS” for marketing effect?
Related pages
Section titled “Related pages”- Raman spectroscopy (baseline)
- IR absorption & proxies
- UV/EUV & fluorescence
- Fiber-optic sensors
- Plasmonic metamaterials
- Electrochemical cells
- Catalytic pellistors
- Why H2 is hard to sense
- Geologic context
References
Section titled “References”Full reference list (68 entries)
- Absolute rotational Raman cross sections for N2, O2, and CO2 (JOSA, 1974) and Raman cross section of some simple gases (JOSA, 1973) — values for N2 absolute backscatter cross-section (1.64×10⁻²⁹ cm²/sr) and H2 relative cross-section (2.2× N2 at 5145 Å). https://opg.optica.org/josa/abstract.cfm?uri=josa-64-5-712; https://opg.optica.org/josa/abstract.cfm?uri=josa-63-1-73
- Absolute Raman Scattering Cross-Section of Molecular Hydrogen. https://ui.adsabs.harvard.edu/abs/1972ApJ…178..551C; https://www.researchgate.net/publication/23897804_Absolute_Raman_Scattering_Cross-Section_of_Molecular_Hydrogen
- Vibrational-rotational Raman spectrum of hydrogen (Q-branch line assignments at 4126/4143/4155/4161 cm⁻¹). https://www.researchgate.net/figure/brational-rotational-Raman-spectrum-of-hydrogen-4156-cm-1-recorded-from-the-anodic_fig5_225023095
- Raman line positions in molecular hydrogen: H2, HD, HT, D2, DT, and T2, Journal of Molecular Spectroscopy. https://www.sciencedirect.com/science/article/pii/0022285287900580
- High-Precision Trace Hydrogen Sensing by Multipass Raman Scattering, Sensors 23(11):5171, 2023 (rotational S(0)/S(1) line positions and Q-branch 4100–4170 cm⁻¹ range). https://pmc.ncbi.nlm.nih.gov/articles/PMC10255963/ ; DOI 10.3390/s23115171
- Multipass Gas Cells — Pfund, White, Herriott, circular multipass cells, RP Photonics Encyclopedia. https://www.rp-photonics.com/multipass_gas_cells.html; Thorlabs Herriott Cells product page. https://www.thorlabs.com/herriott-cells-for-multipass-absorption-spectroscopy
- High-Sensitivity Raman Gas Probe for In Situ Multi-Component Gas Detection, Sensors 21(10):3539, 2021. https://pmc.ncbi.nlm.nih.gov/articles/PMC8160845/
- Multigas Analysis by Cavity-Enhanced Raman Spectroscopy for Power Transformer Diagnosis, Analytical Chemistry, 2020 (Z-shaped four-mirror dense multipass cavity description). https://pubs.acs.org/doi/abs/10.1021/acs.analchem.0c00179
- Cavity-Enhanced Raman Spectroscopy of Natural Gas with Optical Feedback cw-Diode Lasers, Salter, Chu, Hippler, Analytical Chemistry 87(15), 2015. https://pubs.acs.org/doi/10.1021/acs.analchem.5b01462; open-access version: https://eprints.whiterose.ac.uk/89360/1/Hippler%202015%20Analytical%20Chemistry.pdf; PubMed https://pubmed.ncbi.nlm.nih.gov/26161683/
- Cavity-Enhanced Raman Spectroscopy for Detection of Trace Gaseous Impurities in Hydrogen for Fuel Cells, Analytical Chemistry, 2023 (0.5 ppm H2 LOD at 200 s, sub-ppm/ppb impurities at 0.1–2.5 MPa). https://pubs.acs.org/doi/10.1021/acs.analchem.3c00066; PubMed https://pubmed.ncbi.nlm.nih.gov/37073953/
- Multiple Gas Detection by Cavity-Enhanced Raman Spectroscopy with Sub-ppm Sensitivity, Yang et al., Analytical Chemistry, 2023 (finesse >2500, ~1 kW circulating power from ~240 mW PDH-locked input). https://pubs.acs.org/doi/10.1021/acs.analchem.2c05432; author-hosted PDF: http://staff.ustc.edu.cn/~smhu/publication/AC2023Yang-CERS.pdf
- A Short Review of Cavity-Enhanced Raman Spectroscopy for Gas Analysis, Sensors 21(5):1698, 2021. https://www.mdpi.com/1424-8220/21/5/1698
- Cavity-enhanced Raman spectroscopy with optical feedback cw diode lasers for gas phase analysis and spectroscopy, Analyst, 2012. https://pubs.rsc.org/en/content/articlelanding/2012/an/c2an35722d
- Fiber-Enhanced Raman Spectroscopy for Trace-Gas Sensing in the High-Concentration Gas Background With an Anti-Resonant Hollow Core Fiber, Frontiers in Physics, 2022. https://www.frontiersin.org/journals/physics/articles/10.3389/fphy.2022.917688/full
- Review on Hollow-Core Fiber Based Multi-Gas Sensing Using Raman Spectroscopy, Photonic Sensors, 2024 (700× enhancement of HC-PBGF vs. bulk Raman detection). https://link.springer.com/article/10.1007/s13320-024-0730-4
- Improving the Detection Limit in a Capillary Raman System for In Situ Gas Analysis by Means of Fluorescence Reduction, Sensors 15(9):23110, 2015. https://pmc.ncbi.nlm.nih.gov/articles/PMC4610545/
- All-Fiber Multicomponent Gas Raman Probe Based on Platinum-Coated Capillary Enhanced Raman Spectroscopy, ACS Sensors, 2025. https://pubs.acs.org/doi/10.1021/acssensors.4c02954; PubMed https://pubmed.ncbi.nlm.nih.gov/39885655/
- Collision Enhanced Raman Scattering (CERS): An Ultra-High Efficient Raman Enhancement Technique for Hollow Core Photonic Crystal Fiber Based Raman Spectroscopy Gas Analyzer. https://pmc.ncbi.nlm.nih.gov/articles/PMC10669419/
- A New Gas Analysis Method Based on Single-Beam Excitation Stimulated Raman Scattering in Hollow Core Photonic Crystal Fiber Enhanced Raman Spectroscopy (does not support the Dicke-narrowing/gain-coefficient claim it is cited for in Mechanism & physics). https://pmc.ncbi.nlm.nih.gov/articles/PMC10604339/
- Gas Sensor Based on Surface Enhanced Raman Scattering, Sensors, 2021 (ethanol vapor SERS, Si/Ag NP substrate, FDTD enhancement 10⁶–10⁸). https://pmc.ncbi.nlm.nih.gov/articles/PMC7830010/
- Review of SERS Substrates for Chemical Sensing, PMC5485789. https://ncbi.nlm.nih.gov/pmc/articles/PMC5485789
- Picocavity-enhanced Raman Spectroscopy of Physisorbed H2 and D2 Molecules, Shiotari, Liu, Trenins, Sugimoto, Wolf, Rossi, Kumagai, arXiv:2411.10994, 2024 (Fritz Haber Institute; 10 K, sub-nm Ag tip–Ag(111) gap, single-molecule detection). https://arxiv.org/html/2411.10994v1
- CARS Concentration Sensitivity With and Without Nonresonant Background Suppression, Eckbreth & Hall, Combustion Science and Technology 25(5-6), 1981. https://www.tandfonline.com/doi/abs/10.1080/00102208108547501
- Detection systems and methods using coherent anti-Stokes Raman spectroscopy (patent, background discussion of CARS nonresonant interference). https://image-ppubs.uspto.gov/dirsearch-public/print/downloadPdf/9163988
- Gas detection sensitivity of hybrid fs/ps and fs/ns CARS, Optics Letters 47(6):1470, 2022. https://opg.optica.org/ol/abstract.cfm?uri=ol-47-6-1470; OSTI record https://www.osti.gov/biblio/1855811
- Hybrid femtosecond/picosecond coherent anti-Stokes Raman scattering for high-speed gas-phase thermometry. https://www.researchgate.net/publication/45200423_Hybrid_femtosecondpicosecond_coherent_anti-Stokes_Raman_scattering_for_high-speed_gas-phase_thermometry
- Stimulated Raman scattering metrology of molecular hydrogen, Communications Physics, 2023. https://www.nature.com/articles/s42005-023-01187-z
- Trace gas detection of molecular hydrogen H2 by photoacoustic stimulated Raman spectroscopy (PARS), Analyst, 2012 (review of historical 1979-era 40 ppm and dye-laser 4.6 ppm PARS H2 demonstrations). https://pubs.rsc.org/en/content/articlelanding/2012/an/c2an15990b; PubMed https://pubmed.ncbi.nlm.nih.gov/22302187/
- High-Precision Trace Hydrogen Sensing by Multipass Raman Scattering, Singh & Muller, Sensors 23(11):5171, 2023 — Table 1 comparison of H2 detection methods, DOI 10.3390/s23115171. https://pmc.ncbi.nlm.nih.gov/articles/PMC10255963/
- High-Sensitivity, High-Resolution Stimulated Raman Photoacoustic Spectroscopy Enabled by Continuous-Wave Intracavity Pump-Stokes Beams, Nie et al., Laser & Photonics Reviews, 2024/2025. https://onlinelibrary.wiley.com/doi/10.1002/lpor.202501645
- Sandfort, Goldschmidt, Wöllenstein & Palzer, Cavity-Enhanced Raman Spectroscopy for Food Chain Management, Sensors 18(3):709, 2018, PMC5876629 (Fraunhofer IPM PDH/high-finesse CERS approach; not the Hippler group). https://www.ncbi.nlm.nih.gov/pmc/articles/PMC5876629/
- Raman Gas Analysis with External Power Build-Up Cavity of Line-Narrowed 407-nm Laser Diode, Sensors 25(15):4600, 2025. https://www.mdpi.com/1424-8220/25/15/4600
- Stimulated Raman Scattering in Hydrogen-Filled Hollow-Core Photonic Crystal Fiber, Benabid et al., Science 298(5592), 2002. https://www.science.org/doi/10.1126/science.1076408
- Fiber-enhanced Raman spectroscopy for highly sensitive H2 and SO2 sensing with a hollow-core anti-resonant fiber, Wang et al., Optics Express 29(20):32296, 2021. https://opg.optica.org/oe/fulltext.cfm?uri=oe-29-20-32296; PubMed https://pubmed.ncbi.nlm.nih.gov/34615304/
- Trace Gas Monitoring by Hollow-Core Anti-Resonant Fiber-Enhanced Raman Spectroscopy with Sub-ppm Sensitivity, Photonics 12(11):1133, 2025. https://www.mdpi.com/2304-6732/12/11/1133
- Microfluidic Raman Sensing Using a Single Ring Negative Curvature Hollow Core Fiber. https://www.ncbi.nlm.nih.gov/pmc/articles/PMC8615756/ ; Ultra-low background Raman sensing using a negative-curvature fibre and no distal optics, PMC7065639. https://pmc.ncbi.nlm.nih.gov/articles/PMC7065639/
- Raman Gas Sensor Based on Metal-Coated Capillary Cell, Bulletin of the Russian Academy of Sciences: Physics, 2023. https://link.springer.com/article/10.1134/S1062873823704397
- Gas and vapor phase detection of chemical threats on cooled SERS substrates, Talanta/related, 2024–2025 (sub-ppm HCN/Tabun on cooled substrate; 100 ppm general vapor-phase SERS ceiling; film-oxidation lifetime limit). https://www.sciencedirect.com/science/article/abs/pii/S0039914024018617; PubMed https://pubmed.ncbi.nlm.nih.gov/39756259/
- 3D Fractals as SERS Active Platforms: Preparation and Evaluation for Gas Phase Detection of G-Nerve Agents, PMC6187359. https://www.ncbi.nlm.nih.gov/pmc/articles/PMC6187359/
- High-performance hydrogen detection of nanoarrays based on plasmonic enhancement mechanism, Scientific Reports, 2025 (LSPR-based Pd hydrogen sensing, not Raman). https://www.nature.com/articles/s41598-025-31724-5
- Ultrasensitive and fast single wavelength plasmonic hydrogen sensing with anisotropic nanostructured Pd films (LSPR-based, not SERS). https://arxiv.org/pdf/1807.07296
- Neural network enabled nanoplasmonic hydrogen sensors with 100 ppm limit of detection in humid air, Nature Communications, 2024 (LSPR-based, 80% RH tolerance, 140 h continuous operation, not Raman). https://www.nature.com/articles/s41467-024-45484-9; PMC10853499
- All-fiber hydrogen sensor based on stimulated Raman gain spectroscopy with a 1550 nm hollow-core fiber (17 ppm LOD, 250 s). https://arxiv.org/pdf/1611.09705; IEEE conference version https://ieeexplore.ieee.org/iel7/7951194/7960779/07960921.pdf
- Sensitivity enhancement in high resolution stimulated Raman spectroscopy of gases with hollow-core photonic crystal fibers, Optics Letters 38(20):4074. https://opg.optica.org/ol/abstract.cfm?uri=ol-38-20-4074
- High-Precision Trace Hydrogen Sensing by Multipass Raman Scattering, Singh & Muller, Sensors 23(11):5171, 2023, DOI 10.3390/s23115171 (comparison Table 1: chemiresistor 0.01 ppm LOD/~20 s; Schottky diode 0.1 ppm/~10 s; MEMS 0.1 ppm/~2 s; IR absorption 1000 ppm/1 s; PARS 3.4 ppm/~10 s; FERS 4.7 ppm/1–100 s; CERS 0.069 ppm & other values/500–2500 s; this-work multipass cavity 0.06 ppm/600 s). https://pmc.ncbi.nlm.nih.gov/articles/PMC10255963/
- Raman Natural Gas Analyzer: Effects of Composition on Measurement Precision, Petrov, Matrosov, Zaripov, Tanichev, Sensors 22(9), 2022 (532 nm 1.5 W laser, Hamamatsu S10141 CCD, H2 LOD 4.2 ppm at 25 atm/300 K, alkane cross-sensitivity quantification). https://pmc.ncbi.nlm.nih.gov/articles/PMC9099776/
- Aura — characterising gases using Raman, IS-Instruments Ltd product page. https://is-instruments.com/characterising-gases-using-hollow-core-micro-structured-optical-fibre/ ; Hollow core microstructured fibre optics for Raman analysis of gas. https://is-instruments.com/hollow-core-microstructured-fibre-optics-for-raman-analysis-of-gas/ ; Patent awarded for gas phase Raman instrument. https://is-instruments.com/patent-awarded-for-gas-phase-raman-instrument/
- Raman Hydrogen Sensor, Phase 1, Spectral Sciences Inc., DTIC ADA273783 (historical SBIR/AEDC program; 0.0013 atm LOD, 0.3 s response, 18 mW). https://apps.dtic.mil/sti/citations/ADA273783
- Cavity-Enhanced Raman Spectroscopy in the Biosciences: In Situ, Multicomponent, and Isotope Selective Gas Measurements To Study Hydrogen Production and Consumption by Escherichia coli, Smith & Hippler, Analytical Chemistry, 2017 (also PMC7006961 for related follow-on work). https://pubs.acs.org/doi/10.1021/acs.analchem.6b04924; https://pmc.ncbi.nlm.nih.gov/articles/PMC7006961/
- Raman vibrational spectral characteristics and quantitative analysis of H2 up to 400°C and 40 MPa, Li et al., Journal of Raman Spectroscopy, 2018. https://analyticalsciencejournals.onlinelibrary.wiley.com/doi/10.1002/jrs.5420
- Quantitative Raman Spectroscopic Determination of the Composition, Pressure, and Density of CO2-CH4 Gas Mixtures, Chen et al., Journal of Spectroscopy, 2022 (pressure-dependent peak-position/broadening methodology directly analogous to H2 fluid-inclusion work). https://onlinelibrary.wiley.com/doi/10.1155/2022/7238044
- Nanoscale Analysis of Sulfur Poisoning Effects on Hydrogen Sorption in Single Pd Nanoparticles, PMC12574217. https://www.ncbi.nlm.nih.gov/pmc/articles/PMC12574217/
- Natural Hydrogen — Xcalibur Smart Mapping (H-MAS description, Raman Scattering Spectroscopy mechanism, FALCON AGG integration). https://xcaliburmp.com/solution/natural-hydrogen/
- Hnat 2024 — Pioneering Aerial Natural Hydrogen Detection: Xcalibur Smart Mapping’s Breakthrough with Raman LiDAR Technology (link dead — URL now returns 404; page was indexed by search engines with matching title/content as of this review, but no live mirror or archived copy could be retrieved). https://www.hnatworldsummit.com/event/article/xcalibur-smart-mapping/24/pioneering-aerial-natural-hydrogen-detection-xcalibur-smart-mappings-breakthrough-with-raman-lidar-technology
- Airborne Gravity Gradiometry — Xcalibur Smart Mapping (FALCON AGG description). https://xcaliburmp.com/technology/airborne-gravity-gradiometry/
- A World First for Xcalibur Smart Mapping: 3D Hydrogen Plume Mapping with Quantum Raman Spectrometer. https://xcaliburmp.com/a-world-first-for-xcalibur-smart-mapping-3d-hydrogen-plume-mapping-with-quantum-raman-spectrometer/
- Cloudline and Xcalibur Smart Mapping to trial airship-based Raman LiDAR for airborne gas concentration mapping. https://xcaliburmp.com/cloudline-and-xcalibur-smart-mapping-to-trial-airship-based-raman-lidar-for-airborne-gas-concentration-mapping/
- Fiber for Remote Sensing: Downhole sensing applications enhanced by specialty optical fibers, Laser Focus World. https://www.laserfocusworld.com/fiber-optics/article/16551514/fiber-for-remote-sensing-downhole-sensing-applications-enhanced-by-specialty-optical-fibers
- Low profile, high temperature, hydrogen tolerant optical sensing cable (patent; describes H2-induced fiber loss mechanism and reversibility). https://image-ppubs.uspto.gov/dirsearch-public/print/downloadPdf/8864374
- Raman Rxn5 process analyzer, Endress+Hauser product page. https://www.us.endress.com/en/field-instruments-overview/optical-analysis-product-overview/raman-rxn5-analyzer
- How to measure hydrogen in natural gas with Raman spectroscopy, Endress+Hauser process-automation article. https://endressprocessautomation.com/how-to-measure-hydrogen-in-natural-gas-with-raman-spectroscopy/
- Raman Rxn4 analyzer powered by Kaiser Raman technology, Endress+Hauser. https://www.us.endress.com/en/field-instruments-overview/optical-analysis-product-overview/raman-rxn4-analyzer
- Raman Spectroscopy Instrument Pricing: A Comprehensive Guide (general market price banding, $20k–$200k new / $10k–$100k used / >$500k custom). https://www.excedr.com/blog/raman-spectroscopy-instrument-pricing-guide
- HCPCF Technology, Glophotonics. https://glophotonics.fr/technology/ ; Photonic Microcell & Hollow Core Photonic Crystal Fiber. https://glophotonics.fr/products/hollow-core-photonic-cristal-fiber-and-photonic-microcell/
- PowerLink, Glophotonics product page. https://glophotonics.fr/products/powerlink/
- Oil & Gas, Tornado Spectral Systems (link dead — Tornado was acquired by Bruker in Jan 2024 and this URL now redirects to a generic Bruker Raman-process page that does not mention Tornado, oil & gas/LNG, or homonuclear-diatomic detection; no live replacement page with equivalent content was located). https://tornado-spectral.com/applications/oil-gas/
- Herriott Cells for Multipass Absorption Spectroscopy, Thorlabs. https://www.thorlabs.com/herriott-cells-for-multipass-absorption-spectroscopy
- Raman Gas Analyzer for Real-Time Gas Composition Monitoring, Chorpening, Thapa & Buric, NETL, DOE Hydrogen Program 2023 Annual Merit Review (AMR Project ID FE018) (link re-verified live as of 2026-07-04; content confirmed to match — NETL Raman Gas Analyzer, real-time H2 fuel-blend composition monitoring to 1000 psi, >1000x optical-waveguide Raman signal boost, US Patent 8,674,306; the “source PDF 404’d” caveat in the Vendors & products section above predates this re-check and is stale). https://www.hydrogen.energy.gov/docs/hydrogenprogramlibraries/pdfs/review23/fe018_chorpening_2023_p-pdf.pdf